

Question: Example 7: 21 Refer to the trend-adjusted exponential smoothing illustration in Example 7. Using =.2 and =.4, we forecast sales for 9 months, showing the
Example 7:
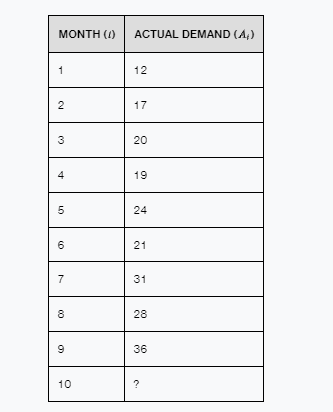
21 Refer to the trend-adjusted exponential smoothing illustration in Example 7. Using =.2 and =.4, we forecast sales for 9 months, showing the detailed calculations for months 2 and 3 . In Solved Problem 4.2, we continued the process for month 4. In this problem, show your calculations for months 5 and 6 for Ft,Tt, and FITt. [PX] \begin{tabular}{|l|l|} \hline MONTH (l) & ACTUAL DEMAND (Ai) \\ \hline 1 & 12 \\ \hline 2 & 17 \\ \hline 3 & 20 \\ \hline 4 & 19 \\ \hline 5 & 24 \\ \hline 6 & 21 \\ \hline 7 & 31 \\ \hline 8 & 28 \\ \hline 9 & 36 \\ \hline 10 & ? \\ \hline \end{tabular}
Step by Step Solution
There are 3 Steps involved in it
1 Expert Approved Answer
Step: 1 Unlock

Question Has Been Solved by an Expert!
Get step-by-step solutions from verified subject matter experts
Step: 2 Unlock
Step: 3 Unlock