

Question: Example 7 . 3 Burger Palace An innovative drive - in - only burger chain has established six units in several different cities. Each unit
Example Burger Palace
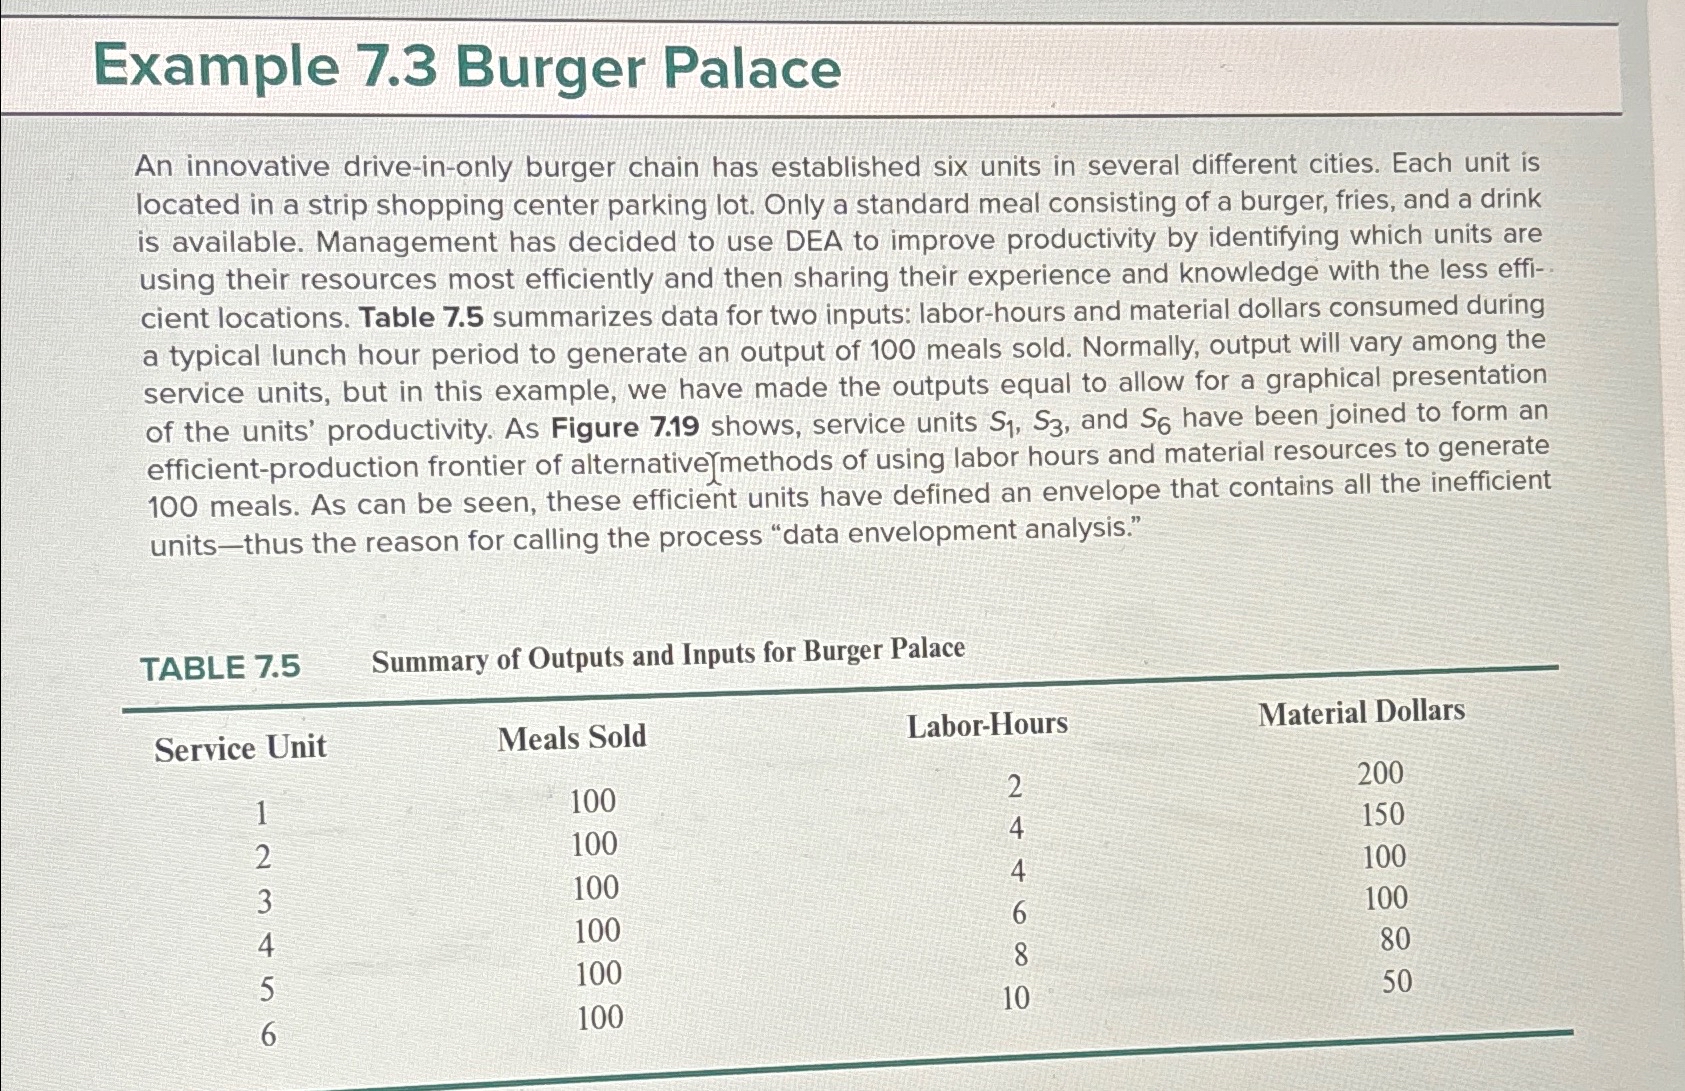
An innovative driveinonly burger chain has established six units in several different cities. Each unit is located in a strip shopping center parking lot. Only a standard meal consisting of a burger, fries, and a drink is available. Management has decided to use DEA to improve productivity by identifying which units are using their resources most efficiently and then sharing their experience and knowledge with the less efficient locations. Table summarizes data for two inputs: laborhours and material dollars consumed during a typical lunch hour period to generate an output of meals sold. Normally, output will vary among the service units, but in this example, we have made the outputs equal to allow for a graphical presentation of the units' productivity. As Figure shows, service units and have been joined to form an efficientproduction frontier of alternative methods of using labor hours and material resources to generate meals. As can be seen, these efficient units have defined an envelope that contains all the inefficient unitsthus the reason for calling the process "data envelopment analysis."
TABLE Summary of Outputs and Inputs for Burger Palace
tableService Unit,Meals Sold,LaborHours,Material Dollars
Exercises
For the Burger Palace kxample, perform a complete analysis of efficiency improvement alternatives for unit including determination of a composite reference unit.
For the Burger Palace example, perform a complete analysis of efficiency improvement alternatives for unit including determination of a composite reference unit.
For the Burger Palace example, what is the effect of removing an inefficient unit from the analysis eg
For the Burger Palace example, what is the effect of removing an efficient unit from the analysis egExample Burger Palace
An innovative driveinonly burger chain has established six units in several different cities. Each unit is located in a strip shopping center parking lot. Only a standard meal consisting of a burger, fries, and a drink is available. Management has decided to use DEA to improve productivity by identifying which units are using their resources most efficiently and then sharing their experience and knowledge with the less efficient locations. Table summarizes data for two inputs: laborhours and material dollars consumed during a typical lunch hour period to generate an output of meals sold. Normally, output will vary among the service units, but in this example, we have made the outputs equal to allow for a graphical presentation of the units' productivity. As Figure shows, service units and have been joined to form an efficientproduction frontier of alternative methods of using labor hours and material resources to generate meals. As can be seen, these efficient units have defined an envelope that contains all the inefficient unitsthus the reason for calling the process "data envelopment analysis."
TABLE Summary of Outputs and Inputs for Burger Palace
tableService Unit,Meals Sold,LaborHours,Material Dollars
Step by Step Solution
There are 3 Steps involved in it
1 Expert Approved Answer
Step: 1 Unlock

Question Has Been Solved by an Expert!
Get step-by-step solutions from verified subject matter experts
Step: 2 Unlock
Step: 3 Unlock