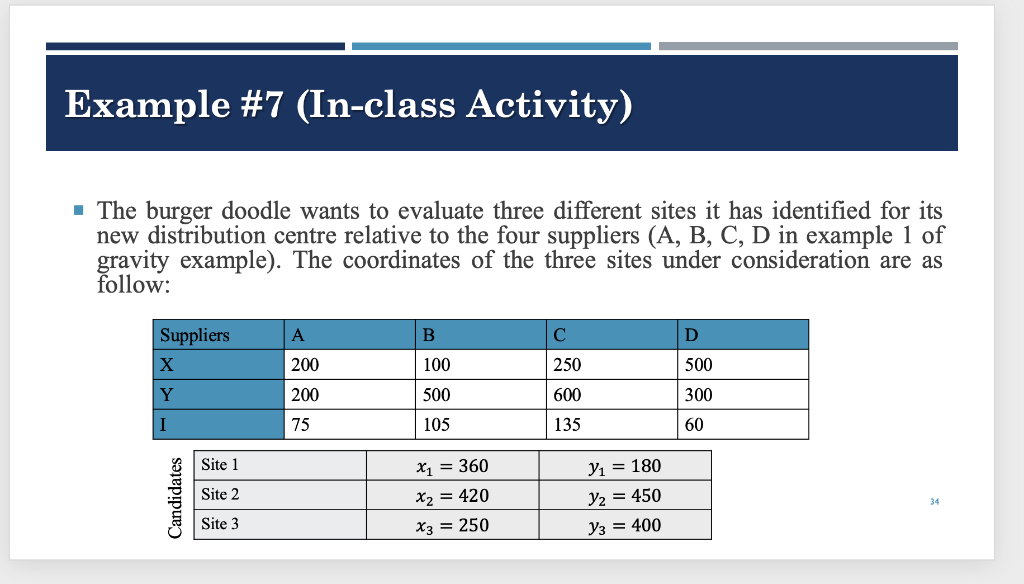
Question: Example #7 (In-class Activity) The burger doodle wants to evaluate three different sites it has identified for its new distribution centre relative to the four

Example #7 (In-class Activity) The burger doodleExample #7 (In-class Activity) The burger doodle

Example #7 (In-class Activity) The burger doodle wants to evaluate three different sites it has identified for its new distribution centre relative to the four suppliers (A, B, C, D in example 1 of gravity example). The coordinates of the three sites under consideration are as follow: Suppliers A B C D X 200 100 250 500 Y 200 500 600 300 I 75 105 135 60 Site 1 Candidates Site 2 x1 = 360 X2 = 420 X3 = 250 Y = 180 Y2 = 450 Y3 = 400 34 Site 3 4. Locational Break-Even Analysis Locational break-even analysis is the use of costvolume analysis to make an economic comparison of location alternatives. By identifying fixed and variable costs and graphing them for each location, we can determine which one provides the lowest cost. Locational break-even analysis can be done mathematically or graphically. The graphic approach has the advantage of providing the range of volume over which each location is preferable. The three steps to locational break-even analysis are as follows: 1. Determine the fixed and variable cost for each location. 2. Plot the costs for each location, with costs on the vertical axis of the graph and annual volume on the horizontal axis. Select the location that has the lowest total cost for the expected production volume. 3. 35 Example #7 (In-class Activity) The burger doodle wants to evaluate three different sites it has identified for its new distribution centre relative to the four suppliers (A, B, C, D in example 1 of gravity example). The coordinates of the three sites under consideration are as follow: Suppliers A B C D X 200 100 250 500 Y 200 500 600 300 I 75 105 135 60 Site 1 Candidates Site 2 x1 = 360 X2 = 420 X3 = 250 Y = 180 Y2 = 450 Y3 = 400 34 Site 3 4. Locational Break-Even Analysis Locational break-even analysis is the use of costvolume analysis to make an economic comparison of location alternatives. By identifying fixed and variable costs and graphing them for each location, we can determine which one provides the lowest cost. Locational break-even analysis can be done mathematically or graphically. The graphic approach has the advantage of providing the range of volume over which each location is preferable. The three steps to locational break-even analysis are as follows: 1. Determine the fixed and variable cost for each location. 2. Plot the costs for each location, with costs on the vertical axis of the graph and annual volume on the horizontal axis. Select the location that has the lowest total cost for the expected production volume. 3. 35

Step by Step Solution

There are 3 Steps involved in it

1 Expert Approved Answer
Step: 1 Unlock blur-text-image
Question Has Been Solved by an Expert!

Get step-by-step solutions from verified subject matter experts

Step: 2 Unlock
Step: 3 Unlock

Students Have Also Explored These Related General Management Questions!