

Question: EXAMPLE 8.5 | Alloy Adhesion An article in the Journal of Materials Engineering [Instrumented Tensile Adhesion Tests on Plasma Sprayed Thermal Barrier Coatings (1989, Vol
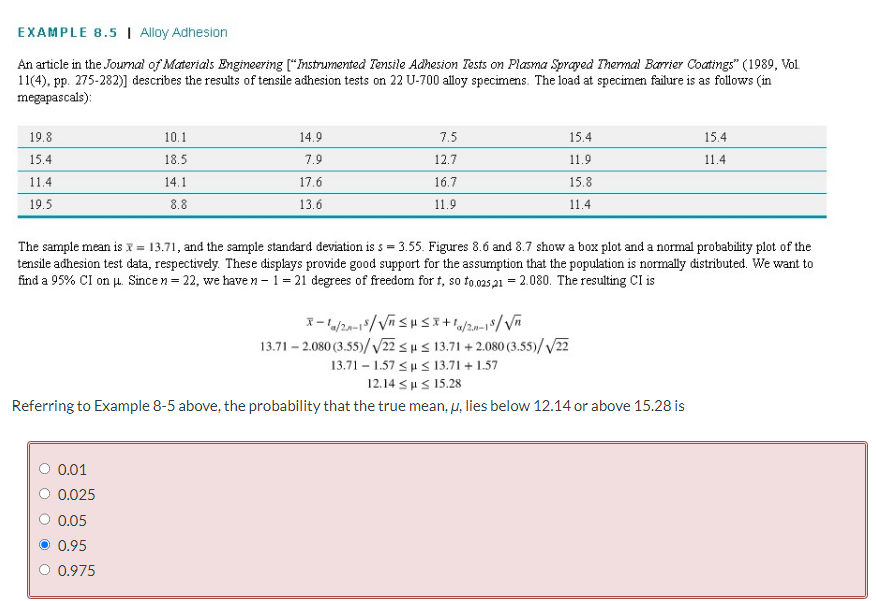
EXAMPLE 8.5 | Alloy Adhesion An article in the Journal of Materials Engineering ["Instrumented Tensile Adhesion Tests on Plasma Sprayed Thermal Barrier Coatings" (1989, Vol 1 1(4), pp. 275-282)] describes the results of tensile adhesion tests on 22 U-700 alloy specimens. The load at specimen failure is as follows (in megapascals): 19.8 10.1 14.9 7.5 15.4 15.4 15.4 18.5 7.9 12.7 11.9 11.4 11.4 14.1 17.6 16.7 15.8 19.5 8.8 13.6 11.9 11.4 The sample mean is > = 13.71, and the sample standard deviation is s = 3.55. Figures 8.6 and 8.7 show a box plot and a normal probability plot of the tensile adhesion test data, respectively. These displays provide good support for the assumption that the population is normally distributed. We want to find a 95% CI on . Since n = 22, we have n - 1 = 21 degrees of freedom for f, so to.025 21 = 2.080. The resulting CI is X -1/20-15/VASHSX+12/20-15/V 13.71 - 2.080 (3.55)/ \\/22 Su S 13.71 + 2.080 (3.55)/ v/22 13.71 - 1.57 Sus 13.71 + 1.57 12.14 Su S 15.28 Referring to Example 8-5 above, the probability that the true mean, , lies below 12.14 or above 15.28 is O 0.01 O 0.025 0 0.05 0 0.95 O 0.975
Step by Step Solution
There are 3 Steps involved in it

Get step-by-step solutions from verified subject matter experts