

Question: Example: As part of a class project at a large university, Amber selected a random sample of 12 students in her major eld of study.
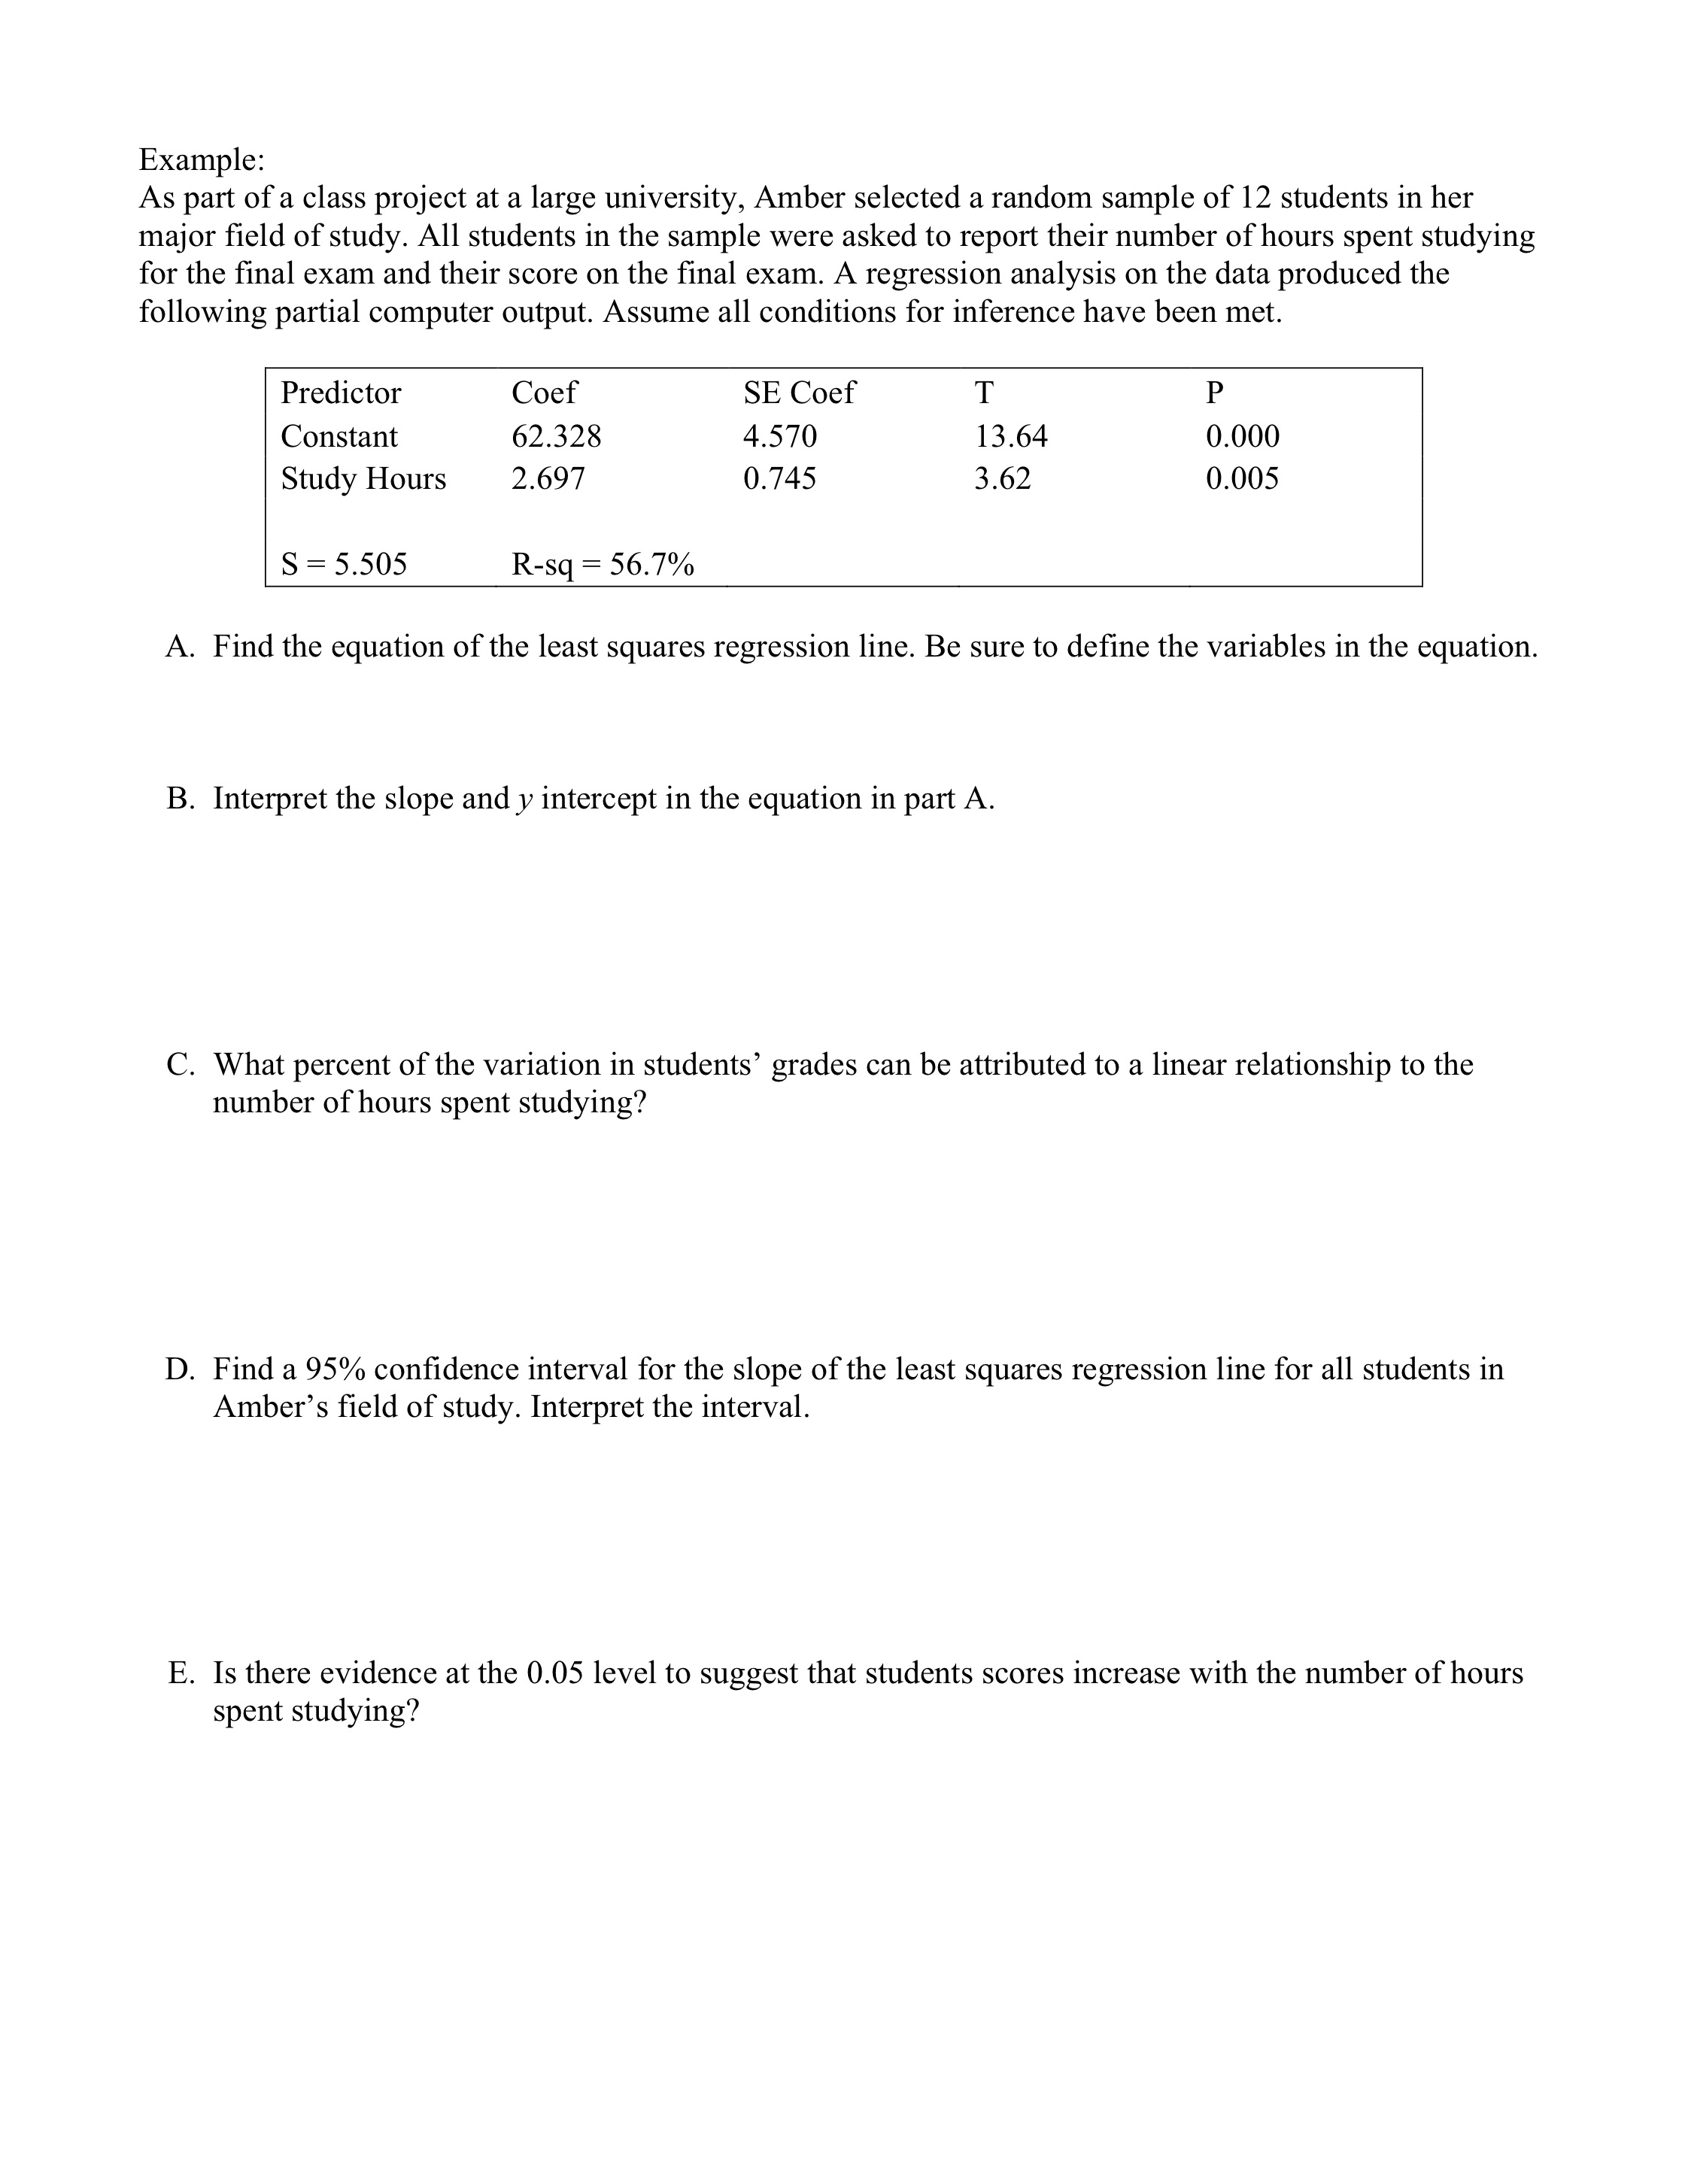
Example: As part of a class project at a large university, Amber selected a random sample of 12 students in her major eld of study. All students in the sample were asked to report their number of hours spent studying for the nal exam and their score on the nal exam. A regression analysis on the data produced the following partial computer output. Assume all conditions for inference have been met. Predictor Coef SE Coef T P Constant 62.328 4.570 13.64 0.000 Study Hours 2.697 0.745 3.62 0.005 S = 5.505 Rsq = 56.7% A. Find the equation of the least squares regression line. Be sure to dene the variables in the equation. B. Interpret the slope and y intercept in the equation in part A. C. What percent of the variation in students' grades can be attributed to a linear relationship to the number of hours spent studying? D. Find a 95% condence interval for the slope of the least squares regression line for all students in Amber's eld of study. Interpret the interval. E. Is there evidence at the 0.05 level to suggest that students scores increase With the number of hours spent studying
Step by Step Solution
There are 3 Steps involved in it

Get step-by-step solutions from verified subject matter experts