

Question: Example below for Question 2.2 Question below- Learning Objective: Total: 35 points Identify the determinants of supply and demand; demonstrate the impact of shifts in
Example below for Question 2.2
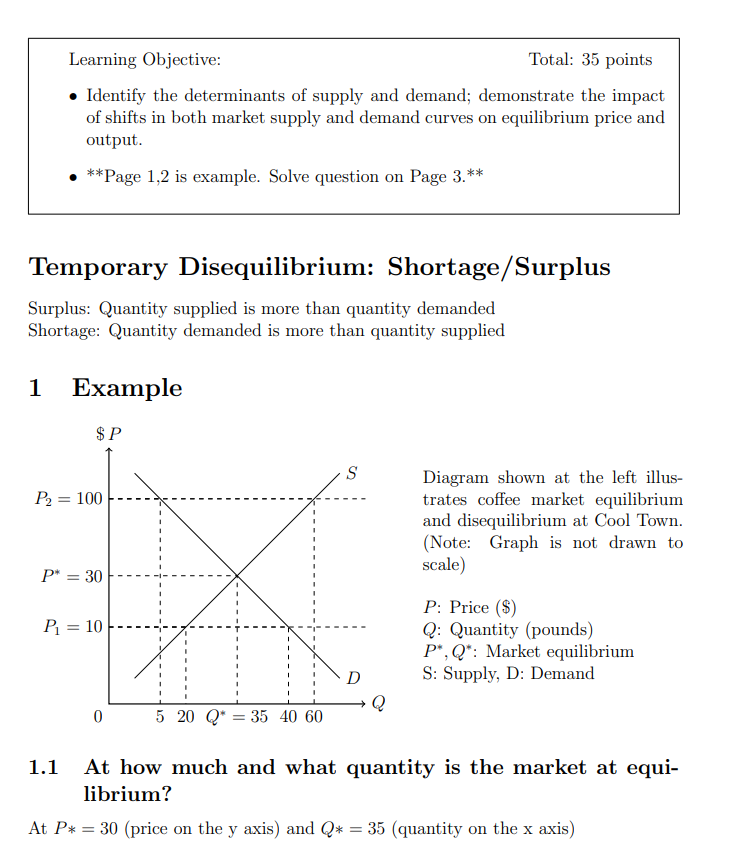
Question below-
Step by Step Solution
There are 3 Steps involved in it
1 Expert Approved Answer
Step: 1 Unlock

Question Has Been Solved by an Expert!
Get step-by-step solutions from verified subject matter experts
Step: 2 Unlock
Step: 3 Unlock