

Question: . EXAMPLE C13 Consider the network shown in Fig. 14.34. The three time estimates, the expected activity durations and the variances are shown along the
.
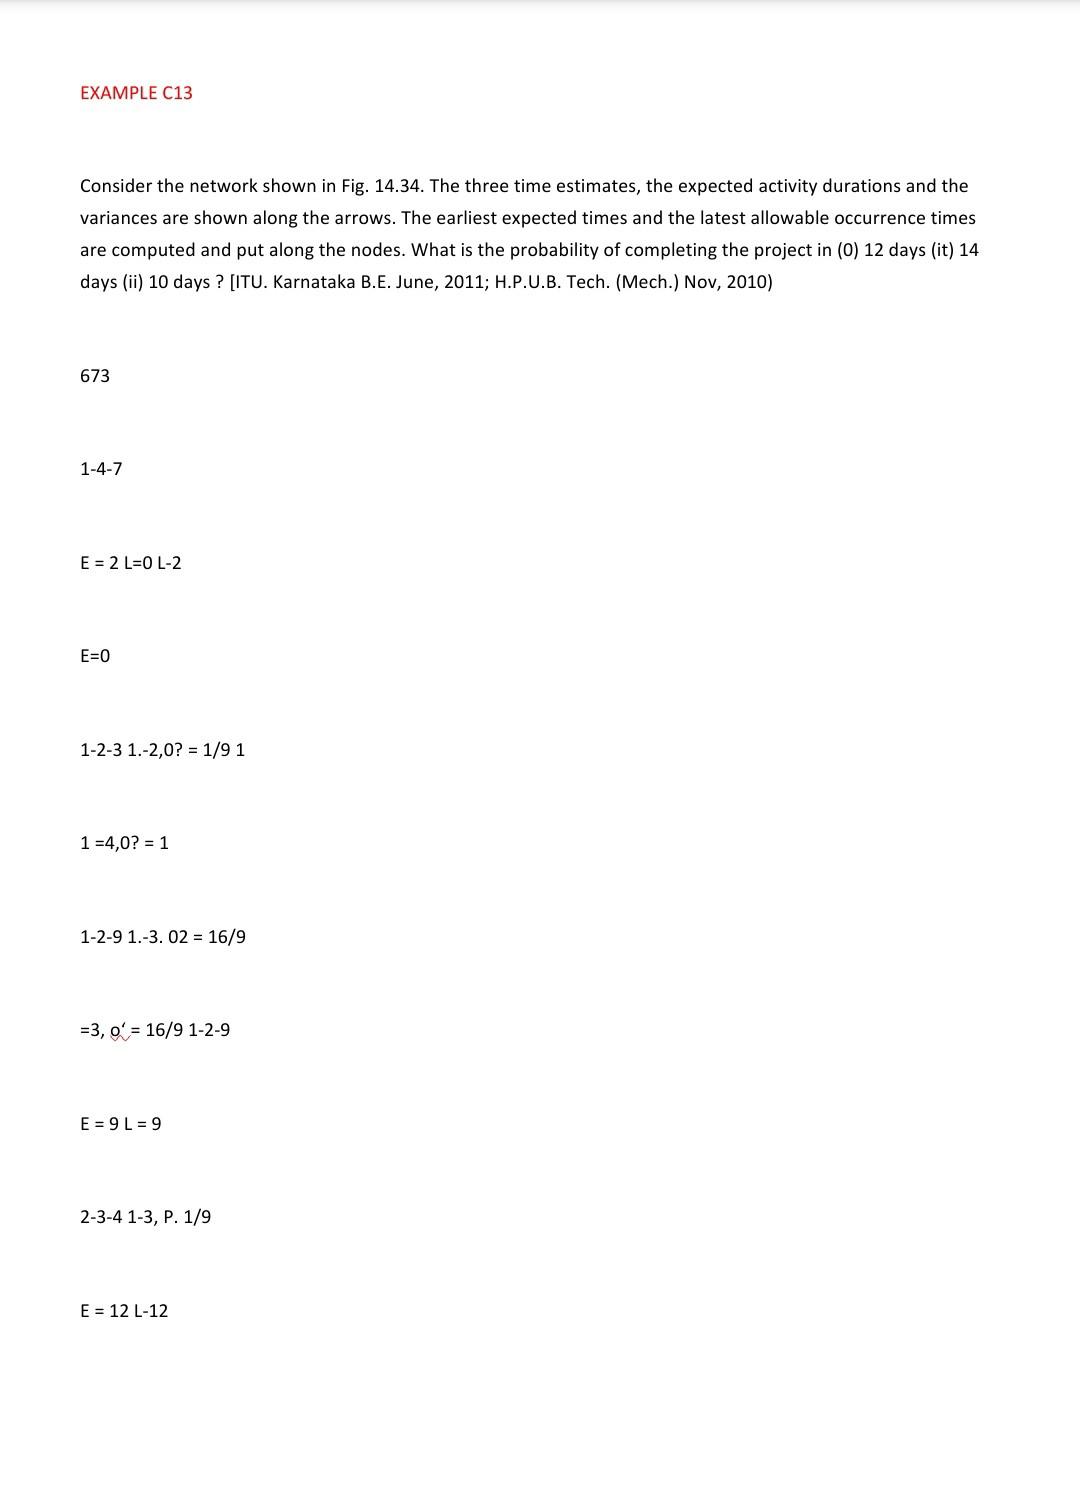
EXAMPLE C13 Consider the network shown in Fig. 14.34. The three time estimates, the expected activity durations and the variances are shown along the arrows. The earliest expected times and the latest allowable occurrence times are computed and put along the nodes. What is the probability of completing the project in (0) 12 days (it) 14 days (ii) 10 days ? [ITU. Karnataka B.E. June, 2011; H.P.U.B.Tech. (Mech.) Nov, 2010) 673 1-4-7 E = 2 L=0 L-2 E=0 1-2-3 1.-2,0? = 1/9 1 1 =4,0? = 1 1-2-9 1.-3. 02 = 16/9 =3, o' = 16/9 1-2-9 E = 9 L = 9 2-3-4 1-3, P. 1/9 E = 12 L-12Step by Step Solution
There are 3 Steps involved in it
1 Expert Approved Answer
Step: 1 Unlock

Question Has Been Solved by an Expert!
Get step-by-step solutions from verified subject matter experts
Step: 2 Unlock
Step: 3 Unlock