

Question: Example: Graphical Integration in Falling - Rate Drying Period A batch of wet solid whose drying - rate curve is represented by Fig. 9 .
Example:
Graphical Integration in FallingRate Drying Period
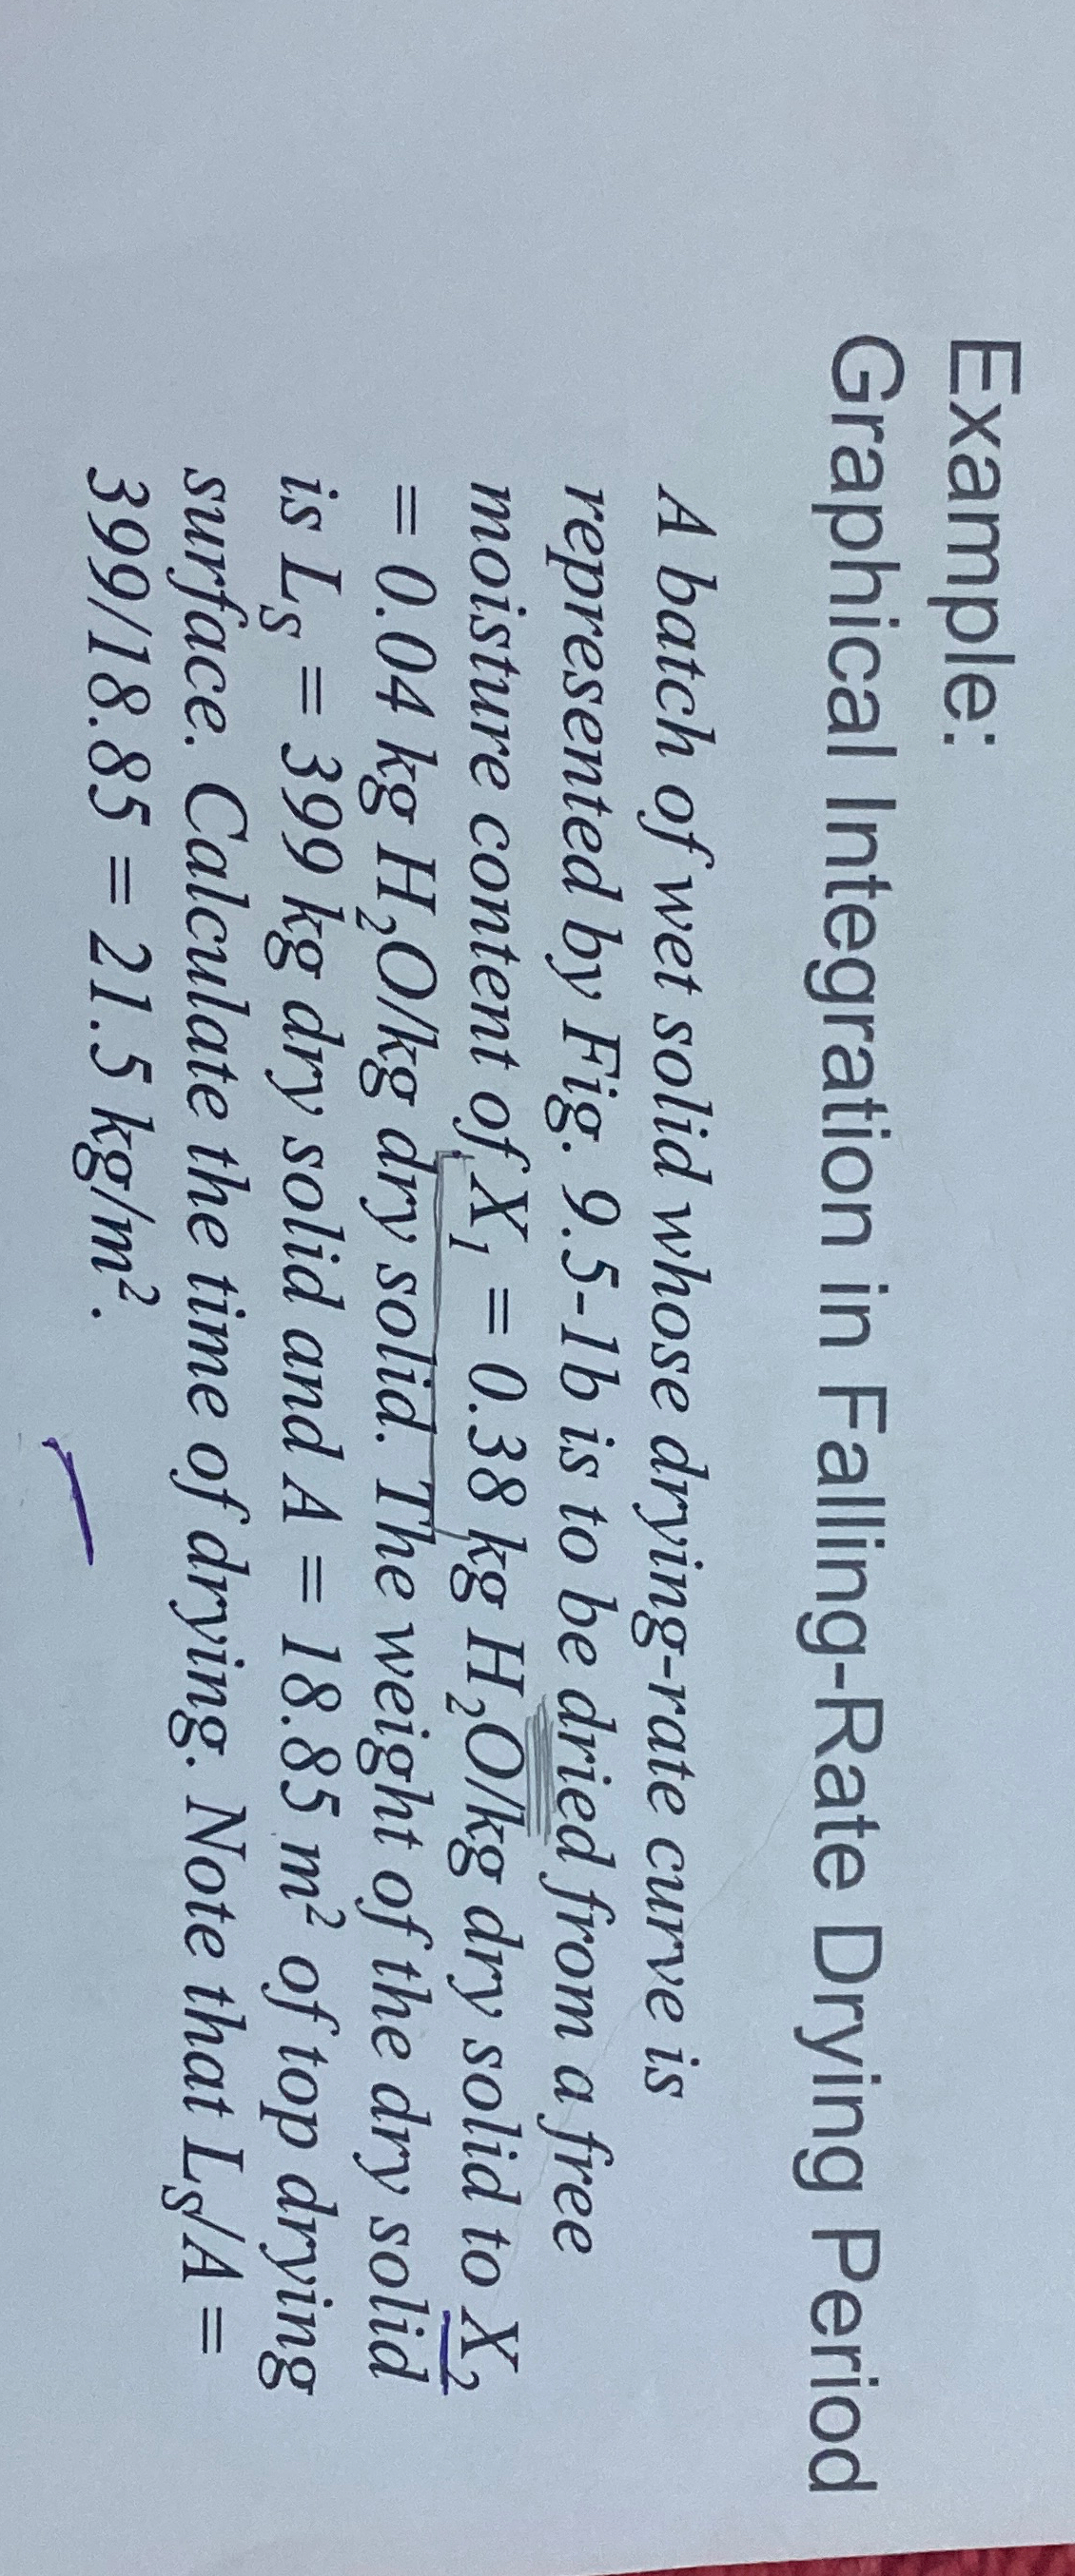
A batch of wet solid whose dryingrate curve is represented by Fig. b is to be dried from a free moisture content of dry solid to dry solid. The weight of the dry solid is dry solid and of top drying surface. Calculate the time of drying. Note that
Step by Step Solution
There are 3 Steps involved in it
1 Expert Approved Answer
Step: 1 Unlock

Question Has Been Solved by an Expert!
Get step-by-step solutions from verified subject matter experts
Step: 2 Unlock
Step: 3 Unlock