

Question: Example: myGraph = bossGraph = [' ' [' % ' ' # ' ' % %' ' # # ' ' ' ' # #
![# # # ']; ' % ' ' % ' ' %](https://dsd5zvtm8ll6.cloudfront.net/si.experts.images/questions/2024/09/66f3a7e5acdb7_26166f3a7e5290b0.jpg)
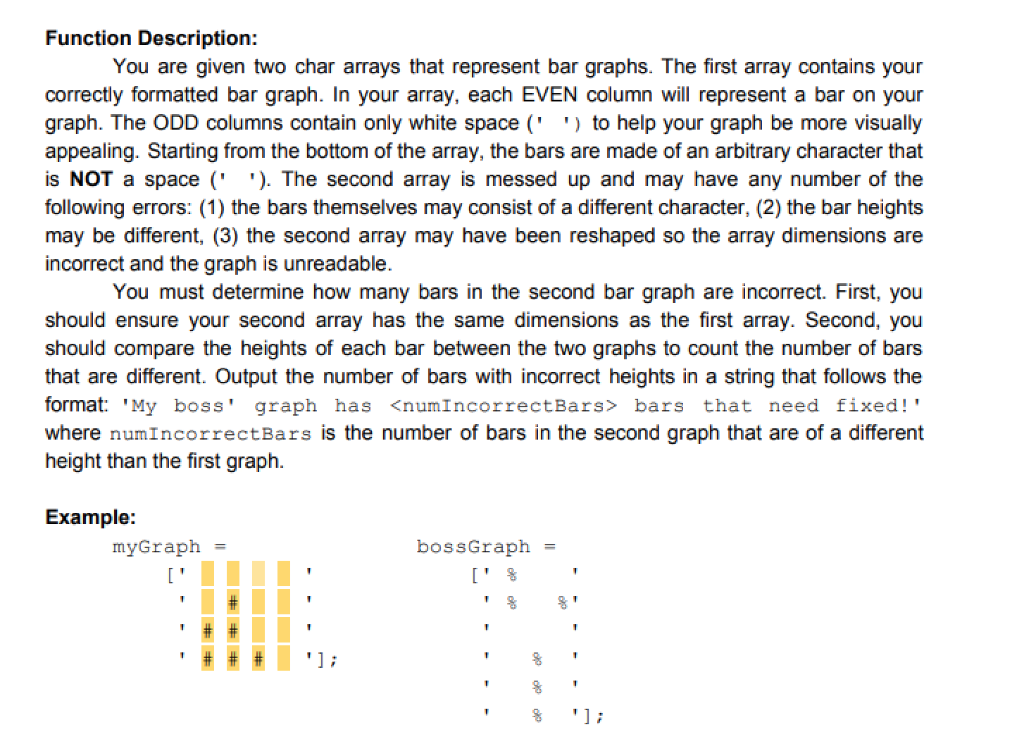
Example:
myGraph = bossGraph =
[' ' [' % '
' # ' ' % %'
' # # ' ' '
' # # # ']; ' % '
' % '
' % '];
Homework 05 - Arrays
str = graphcmp(myGraph, bossGraph);
str 'My boss' graph has 3 bars that need fixed!'
Please Solve using matlab! To receive a thumbs up DO NOT USE CONDITIONAL STATEMENTS(if, else, elseif) or ITERATIONS (loops) in you solution code!! Question Updated!!
Function Name: graphcmp Inputs: 1. (char) A MXN char array representing a bar graph 2. (char) A KxL char array representing a misformated bar graph Outputs: 1. (char) A formatted string describing the mistakes in the second graph Topics: (masking), (array operations) Background: You are a hardworking intern at CS1371 Corp and have compiled some performance data on different employees to help your boss decide who should get a raise at the end of the quarter. However, your boss can be a bit of a dunce and has messed up your nicely formatted graphs! You must now find the differences between the two graphs and inform your boss of how they messed up! Function Description: You are given two char arrays that represent bar graphs. The first array contains your correctly formatted bar graph. In your array, each EVEN column will represent a bar on your graph. The ODD columns contain only white space (' ') to help your graph be more visually appealing. Starting from the bottom of the array, the bars are made of an arbitrary character that is NOT a space (' '). The second array is messed up and may have any number of the following errors: (1) the bars themselves may consist of a different character, (2) the bar heights may be different, (3) the second array may have been reshaped so the array dimensions are incorrect and the graph is unreadable. You must determine how many bars in the second bar graph are incorrect. First, you should ensure your second array has the same dimensions as the first array. Second, you should compare the heights of each bar between the two graphs to count the number of bars that are different. Output the number of bars with incorrect heights in a string that follows the format: 'My boss' graph has
Step by Step Solution
There are 3 Steps involved in it

Get step-by-step solutions from verified subject matter experts