

Question: Example: The bar graph shows how we spend our leisure time. Use the graph to represent the set of leisure activities in which participation exceeds
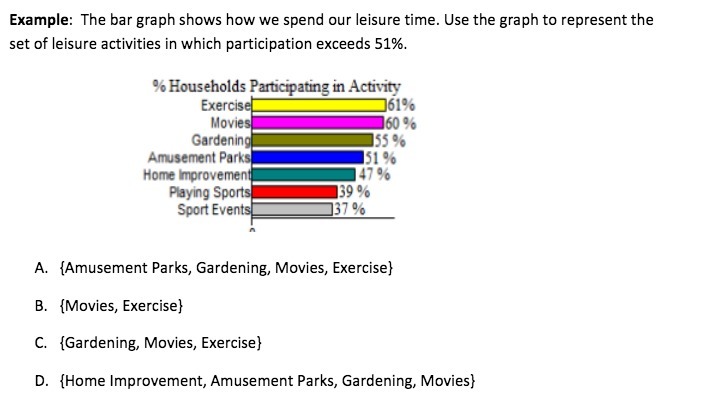
Example: The bar graph shows how we spend our leisure time. Use the graph to represent the set of leisure activities in which participation exceeds 51%. % Households Participating in Activity Exercise 61% Movies 60 % Gardening 55% Amusement Parks 51% Home Improvement 47 % Playing Sports 39 % Sport Events 137 % A. {Amusement Parks, Gardening, Movies, Exercise} B. {Movies, Exercise} C. {Gardening, Movies, Exercise} D. {Home Improvement, Amusement Parks, Gardening, Movies}
Step by Step Solution
There are 3 Steps involved in it
1 Expert Approved Answer
Step: 1 Unlock

Question Has Been Solved by an Expert!
Get step-by-step solutions from verified subject matter experts
Step: 2 Unlock
Step: 3 Unlock