

Question: EXAMPLE The following data investigates the association between average monthly temperature (F) and electrical usage (kilowatt hours) for a home. MONTH AVERAGE ELEC MONTH
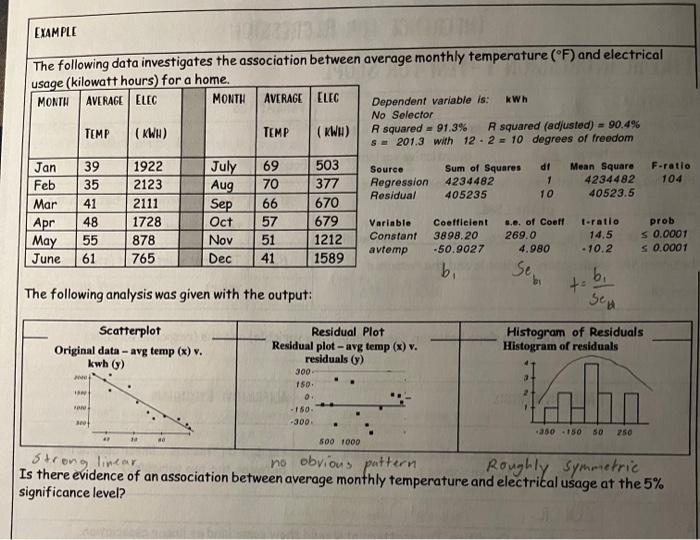
EXAMPLE The following data investigates the association between average monthly temperature (F) and electrical usage (kilowatt hours) for a home. MONTH AVERAGE ELEC MONTH AVERAGE ELEC Dependent variable is: kWh No Selector TEMP (KWH) TEMP (KWH) R squared 91.3% R squared (adjusted) = 90.4% s=201.3 with 12-2 10 degrees of freedom Jan 39 1922 July 69 503 Source Sum of Squares df Mean Square F-ratio Feb 35 2123 Aug 70 377 Regression 4234482 1 4234482 104 Residual 405235 10 40523.5 Mar 41 2111 Sep 66 670 Apr 48 1728 Oct 57 679 Variable Coefficient s.e. of Coeff t-ratio May 55 878 Nov 51 1212 Constant 3898.20 269.0 14.5 prob 0.0001 avtemp -50.9027 4.980 -10.2 < 0.0001 June. 61 765 Dec 41 1589 b Se b The following analysis was given with the output: Scatterplot Residual Plot Original data-avg temp (x) v. 2000- kwh (y) Residual plot-avg temp (x) v. residuals (y) 300- 150- 0. -150- Sed Histogram of Residuals Histogram of residuals 300 Strong linear 40 -300- 500 1000 no obvious pattern 350 150 50 250 Roughly Symmetric Is there evidence of an association between average monthly temperature and electrical usage at the 5% significance level?
Step by Step Solution
There are 3 Steps involved in it

Get step-by-step solutions from verified subject matter experts