

Question: Example: The graph below shows the rate r(t) (in arrivals per hour) at which people arrive at a polling place to vote. The first people
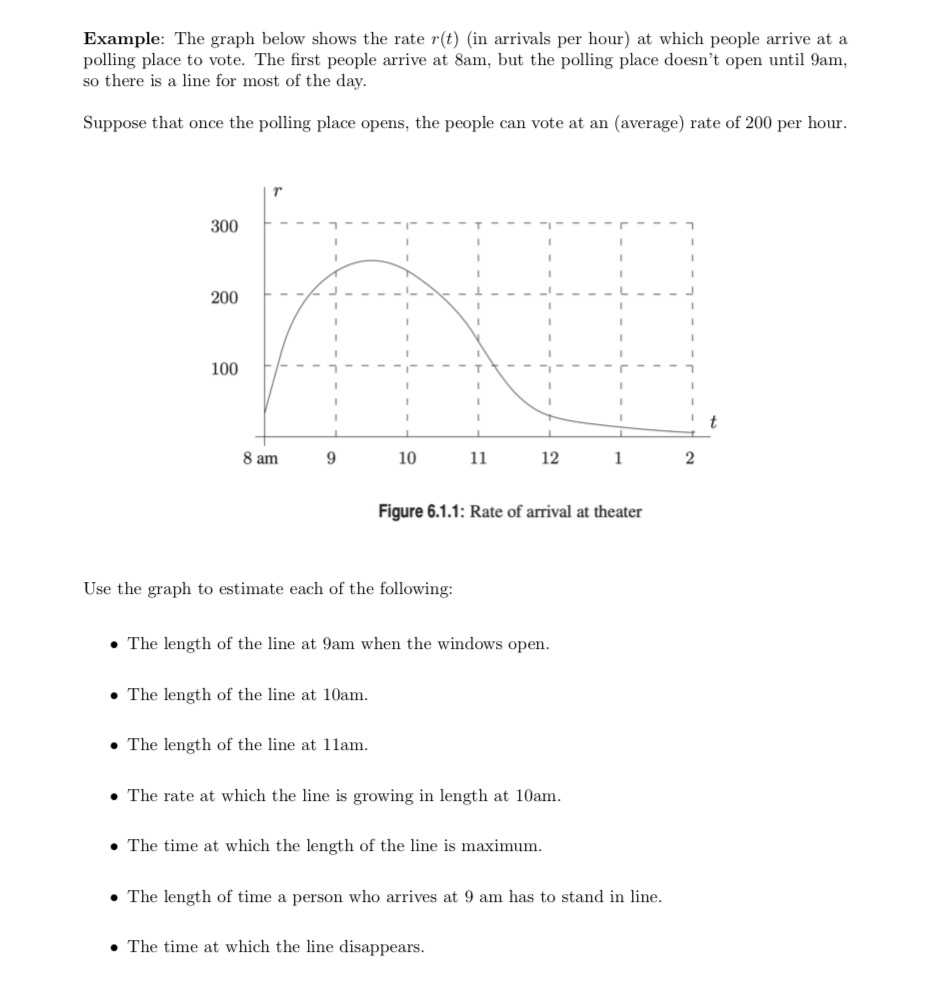
Example: The graph below shows the rate r(t) (in arrivals per hour) at which people arrive at a polling place to vote. The first people arrive at 8am, but the polling place doesn't open until 9am, so there is a line for most of the day. Suppose that once the polling place opens, the people can vote at an (average) rate of 200 per hour. 300 200 100 8 am 9 10 11 12 1 2 Figure 6.1.1: Rate of arrival at theater Use the graph to estimate each of the following: . The length of the line at 9am when the windows open. . The length of the line at 10am. . The length of the line at 1lam. . The rate at which the line is growing in length at 10am. . The time at which the length of the line is maximum. . The length of time a person who arrives at 9 am has to stand in line. . The time at which the line disappears
Step by Step Solution
There are 3 Steps involved in it

Get step-by-step solutions from verified subject matter experts