

Question: Excel Activity: Interest Rate Determination and Yield Curves The data has been collected in the Microsoft Excel file below. Download the spreadsheet and perform the
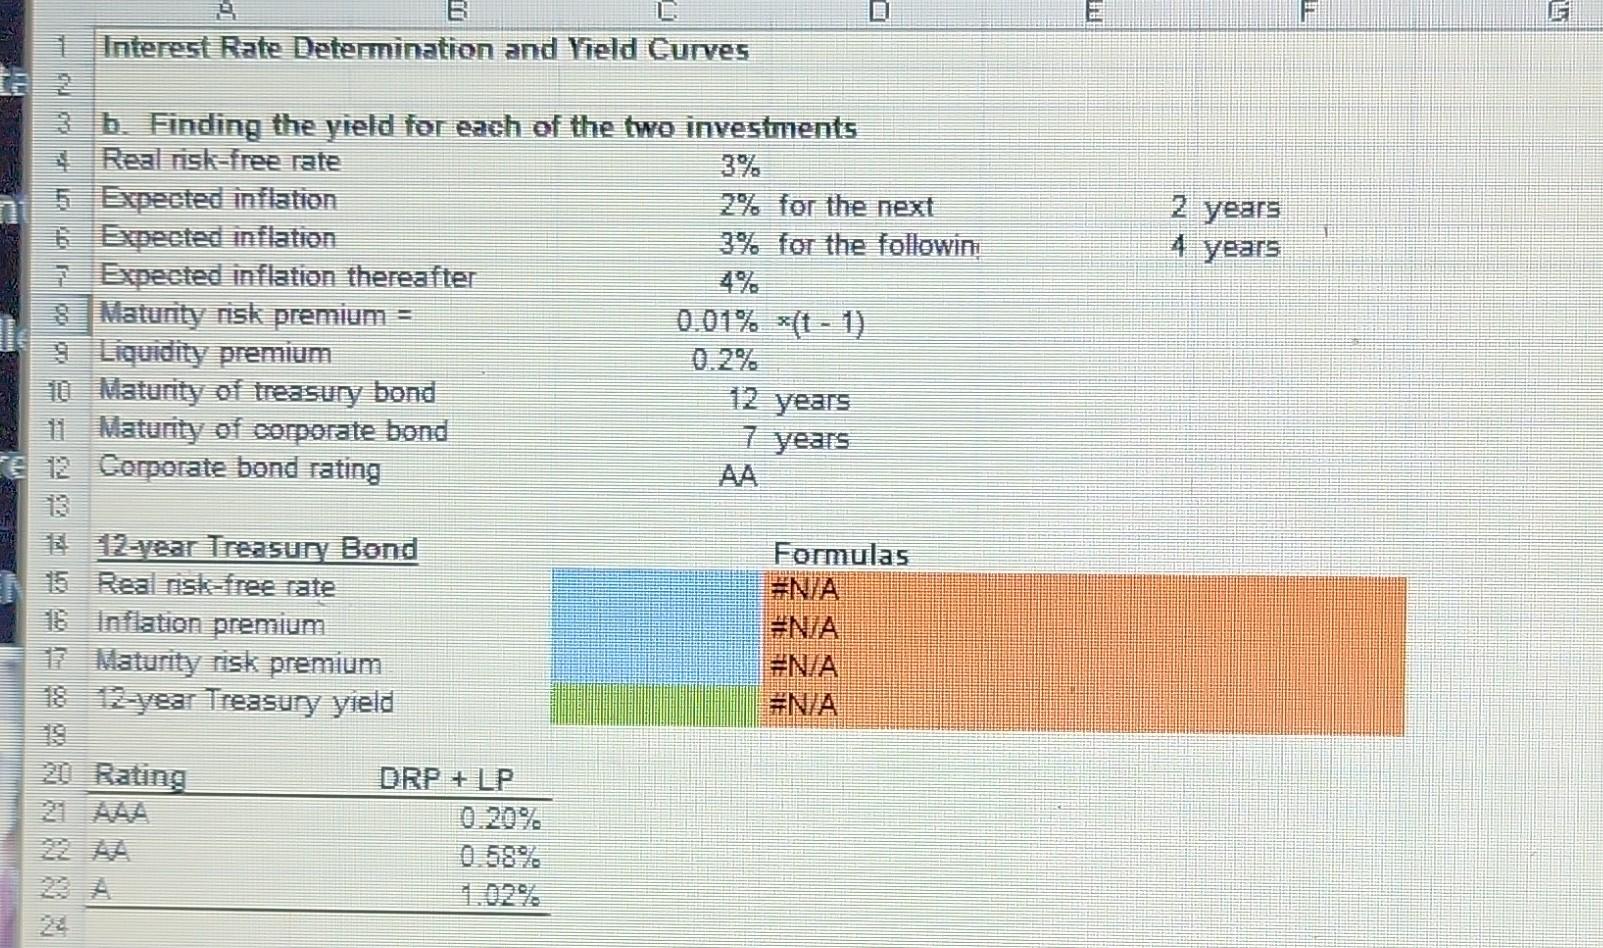
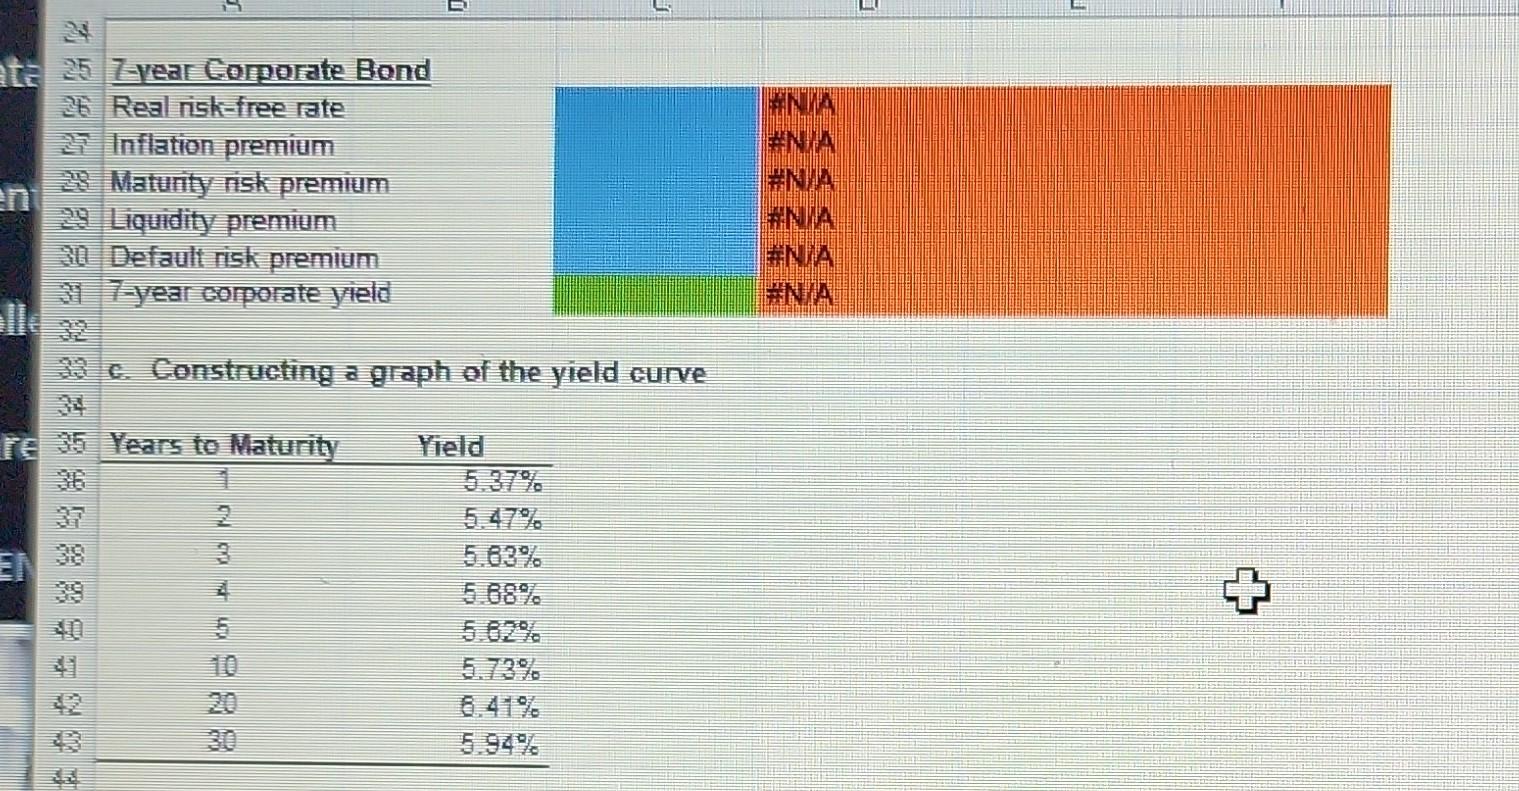
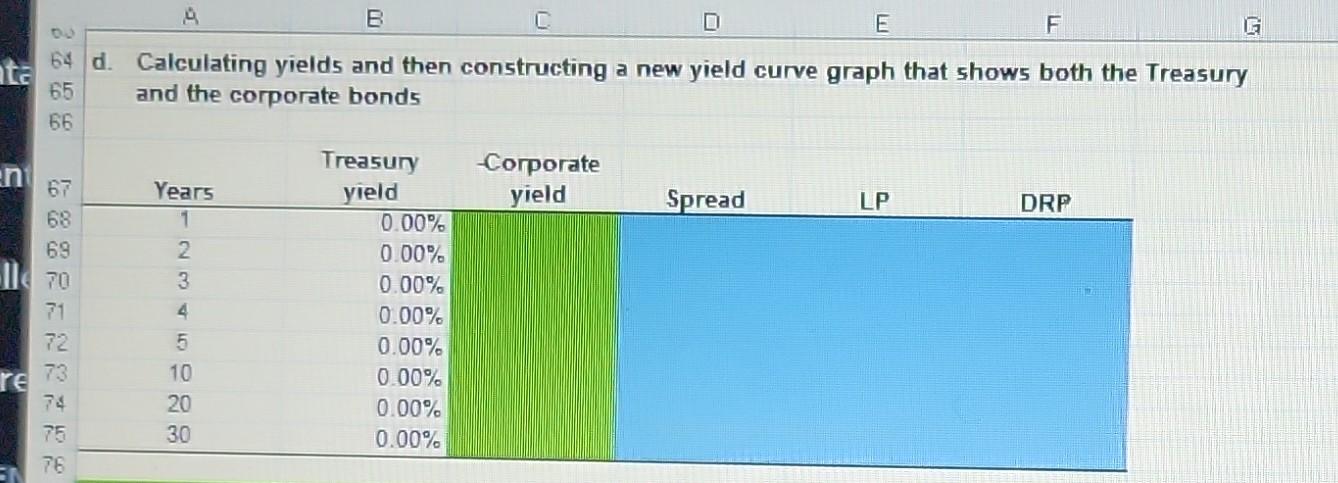
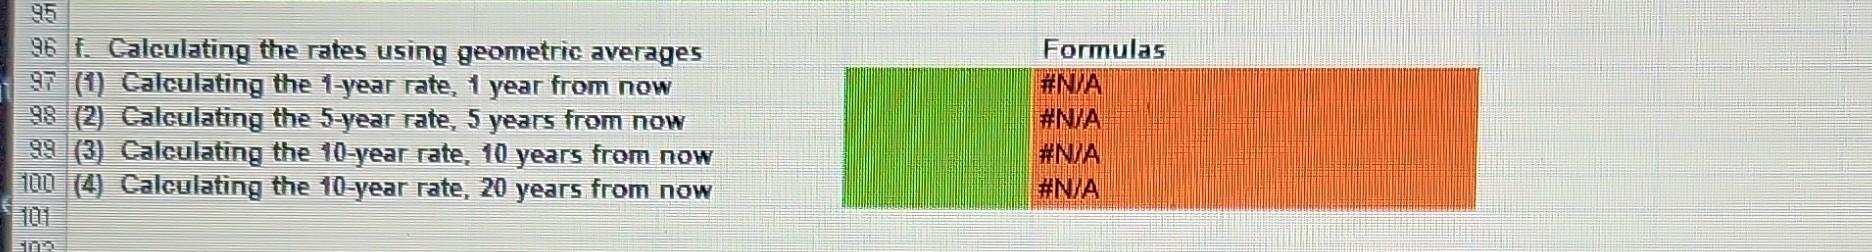
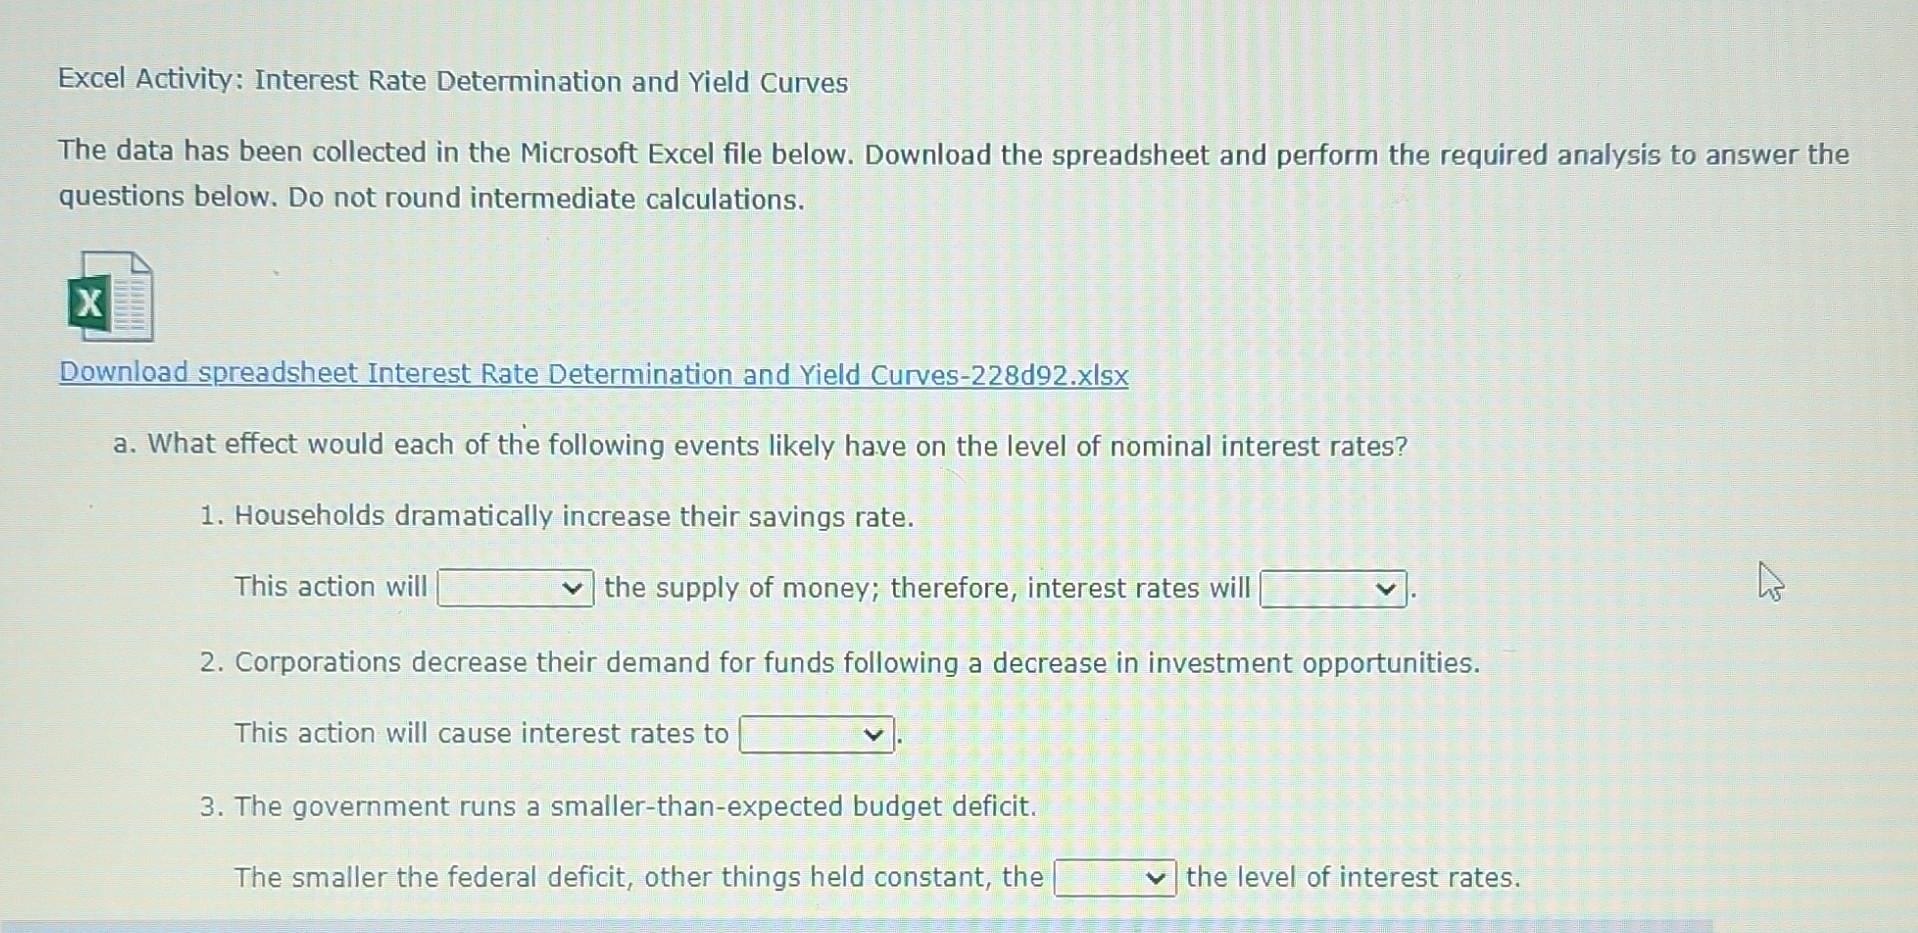
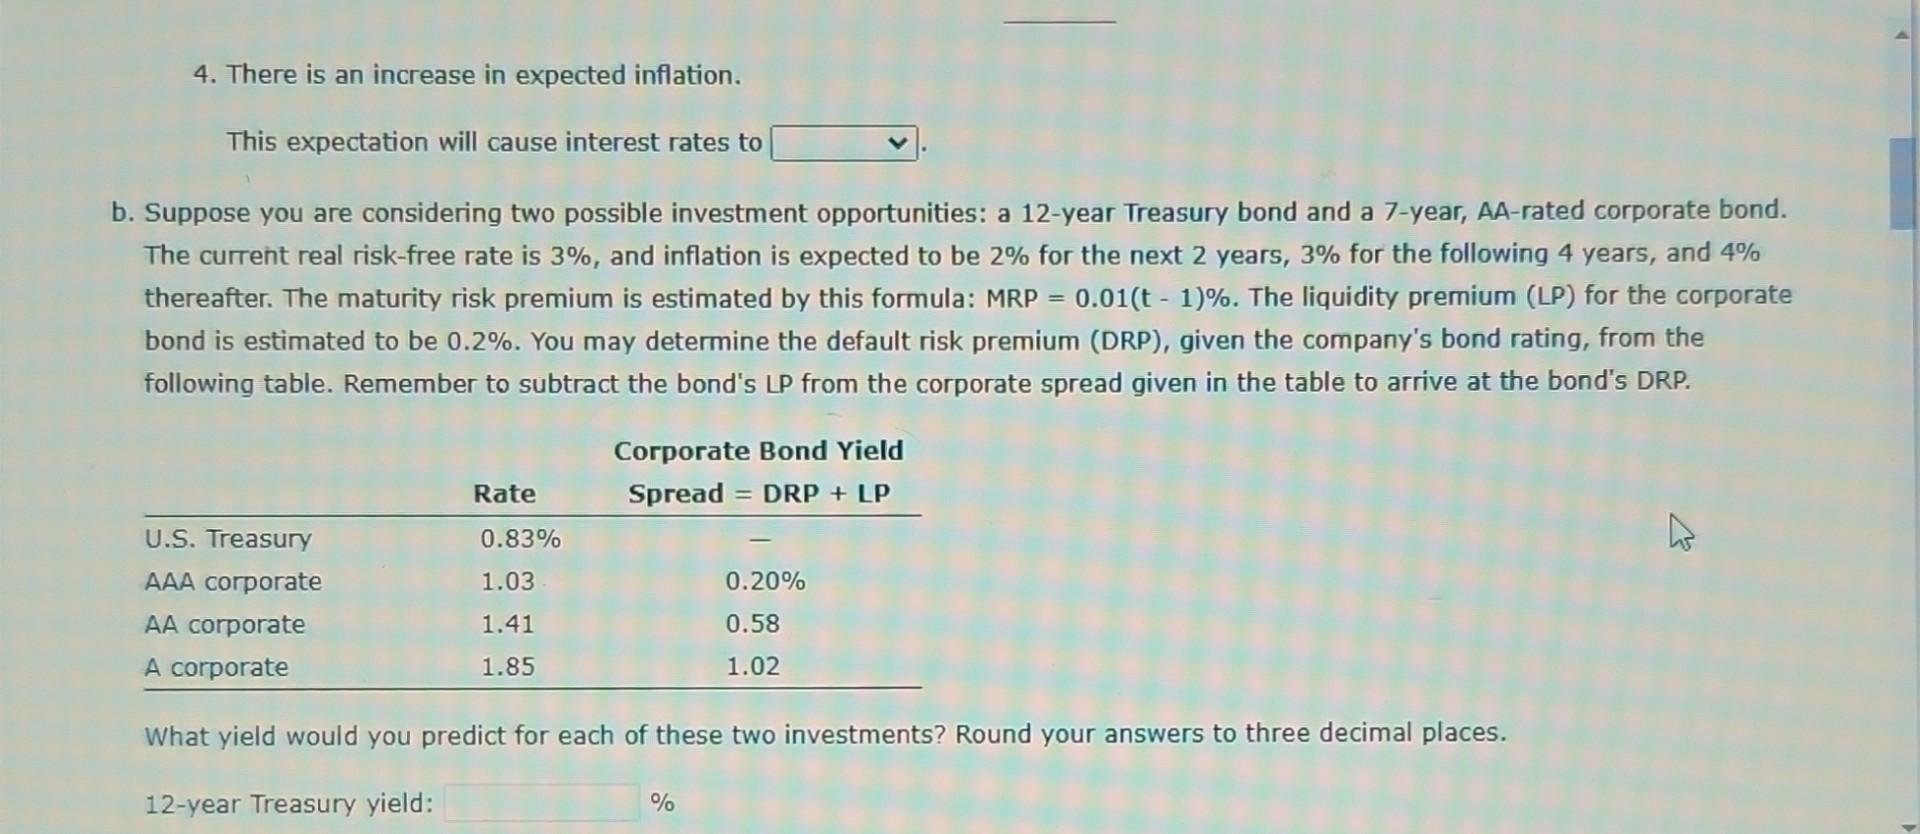
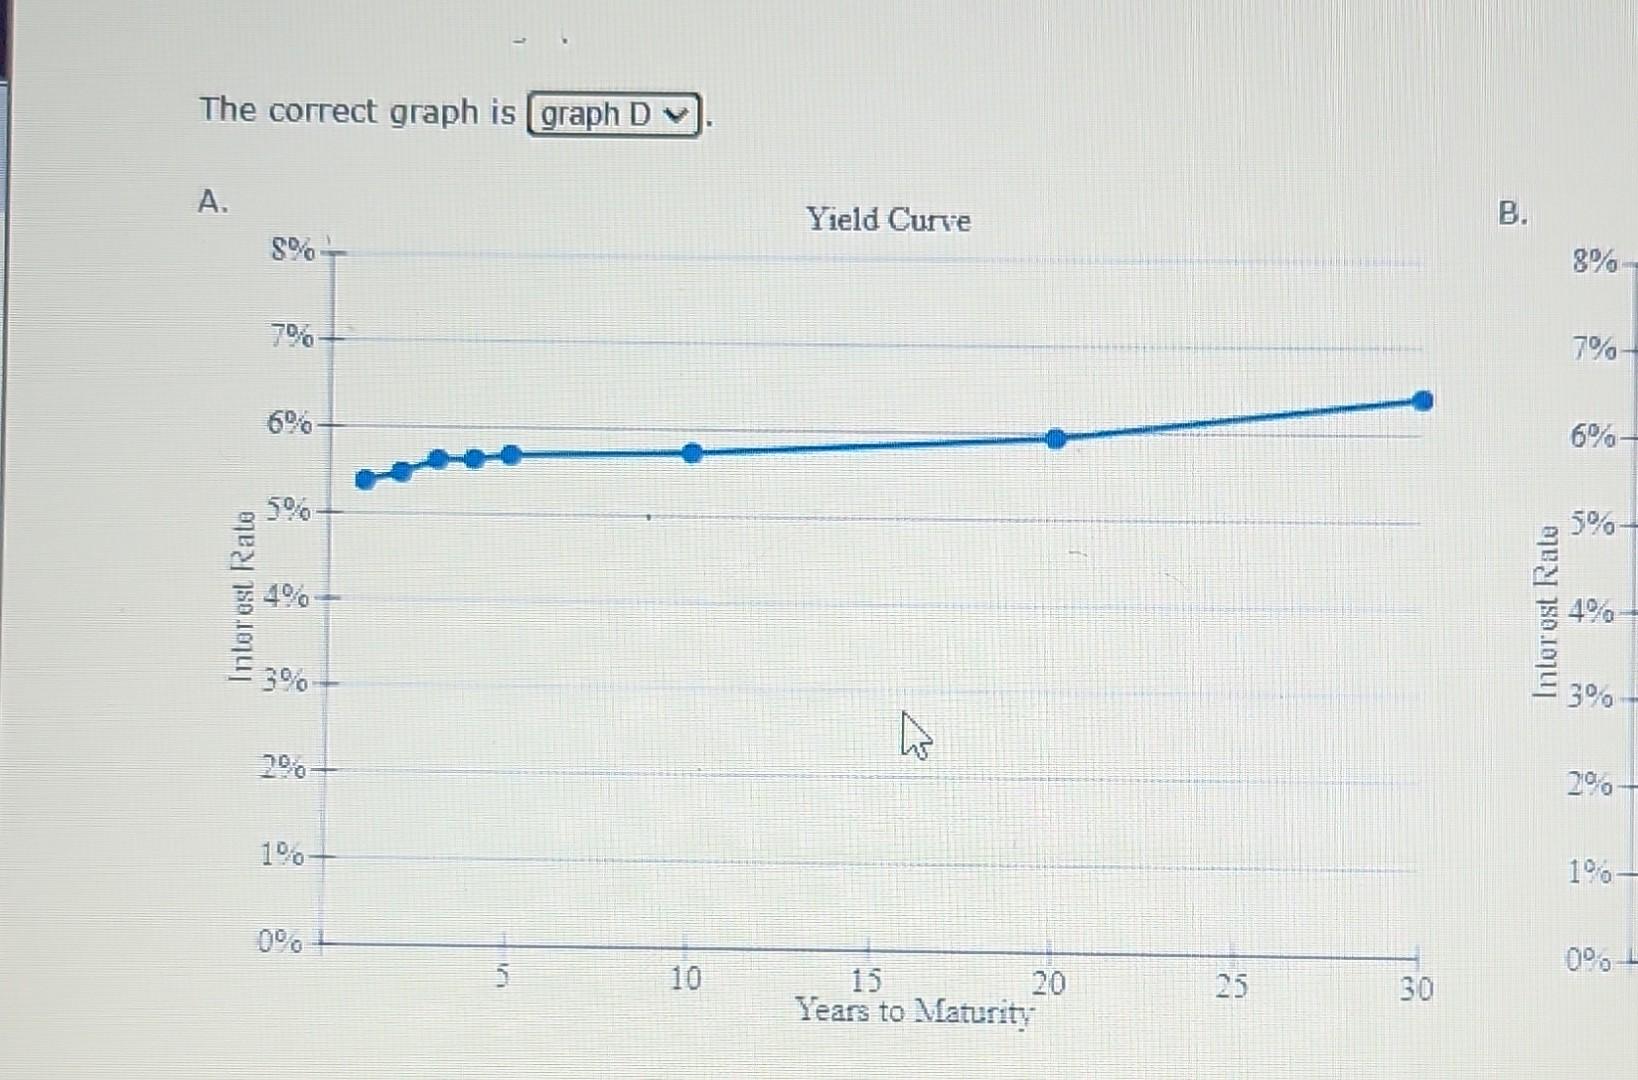
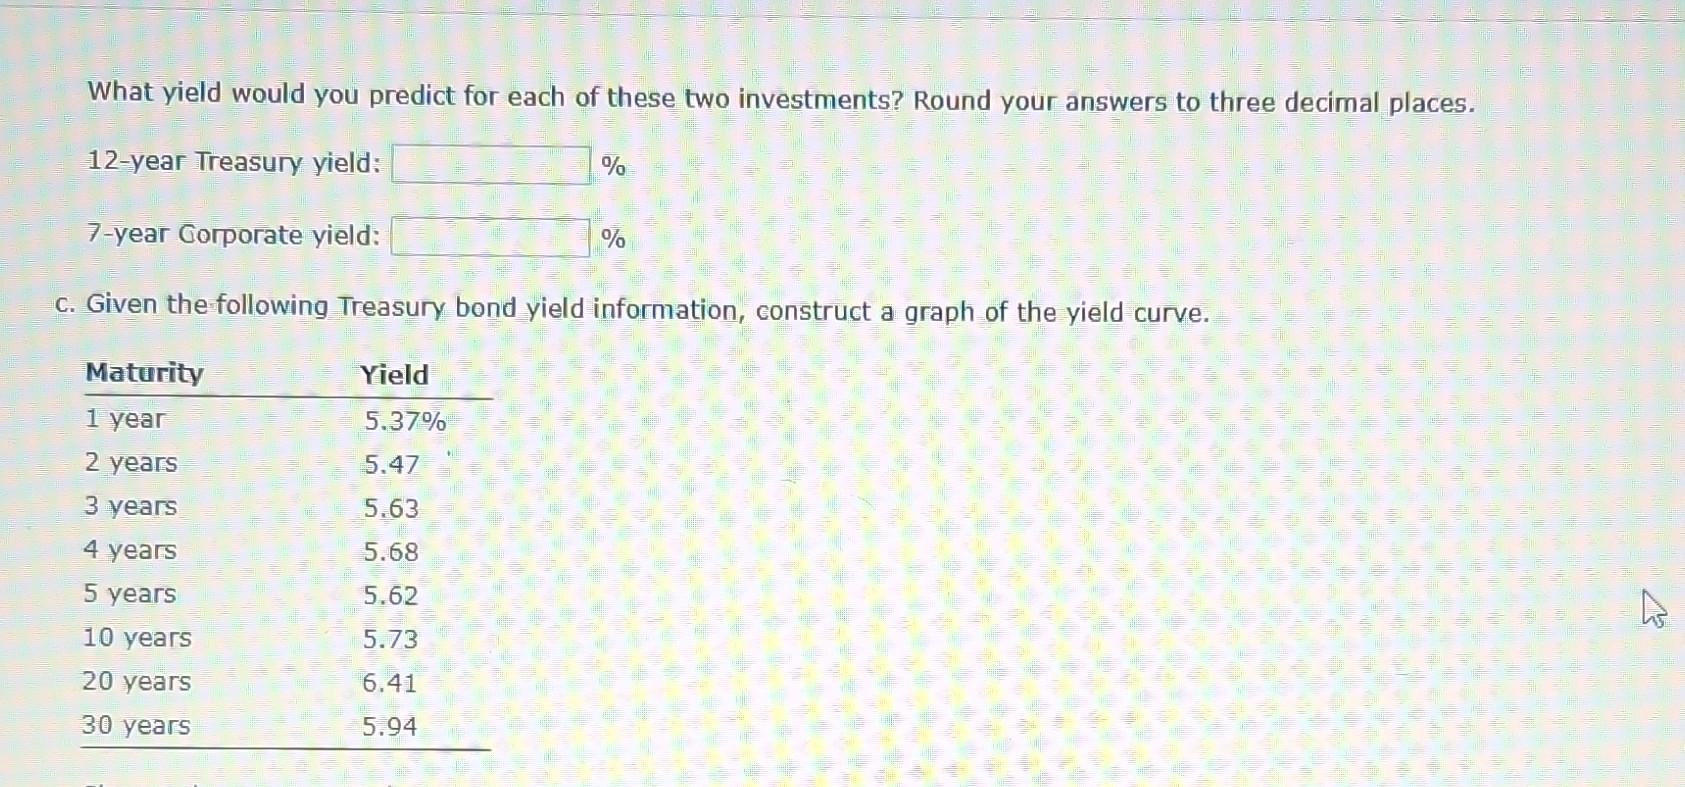
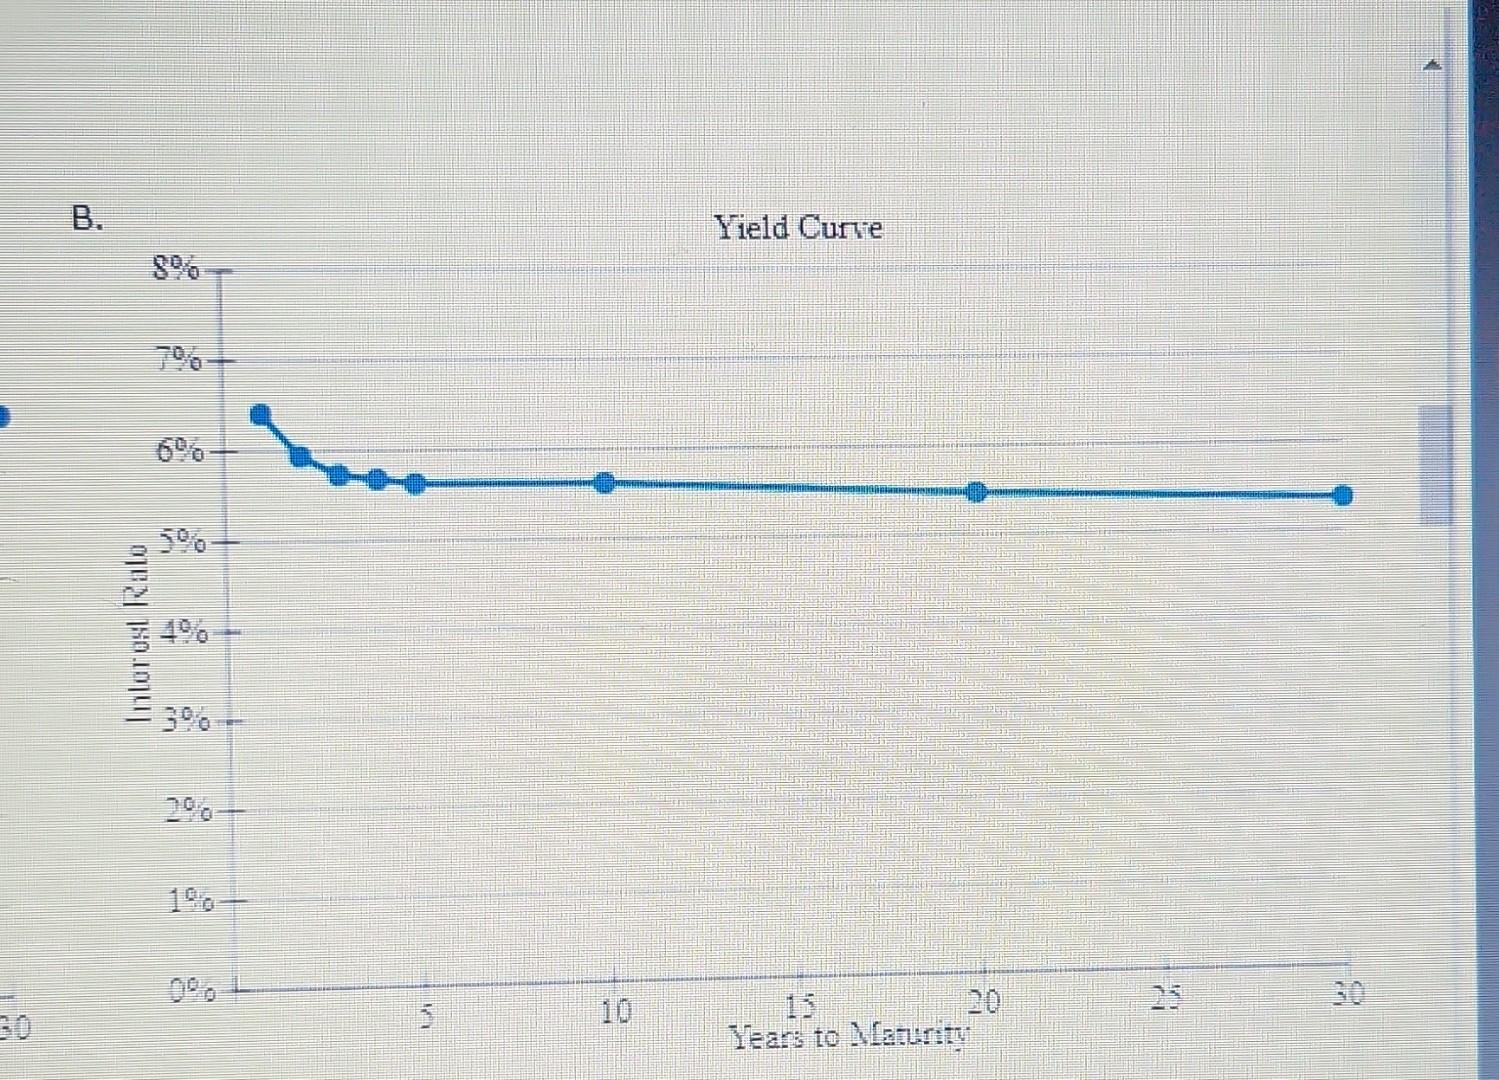
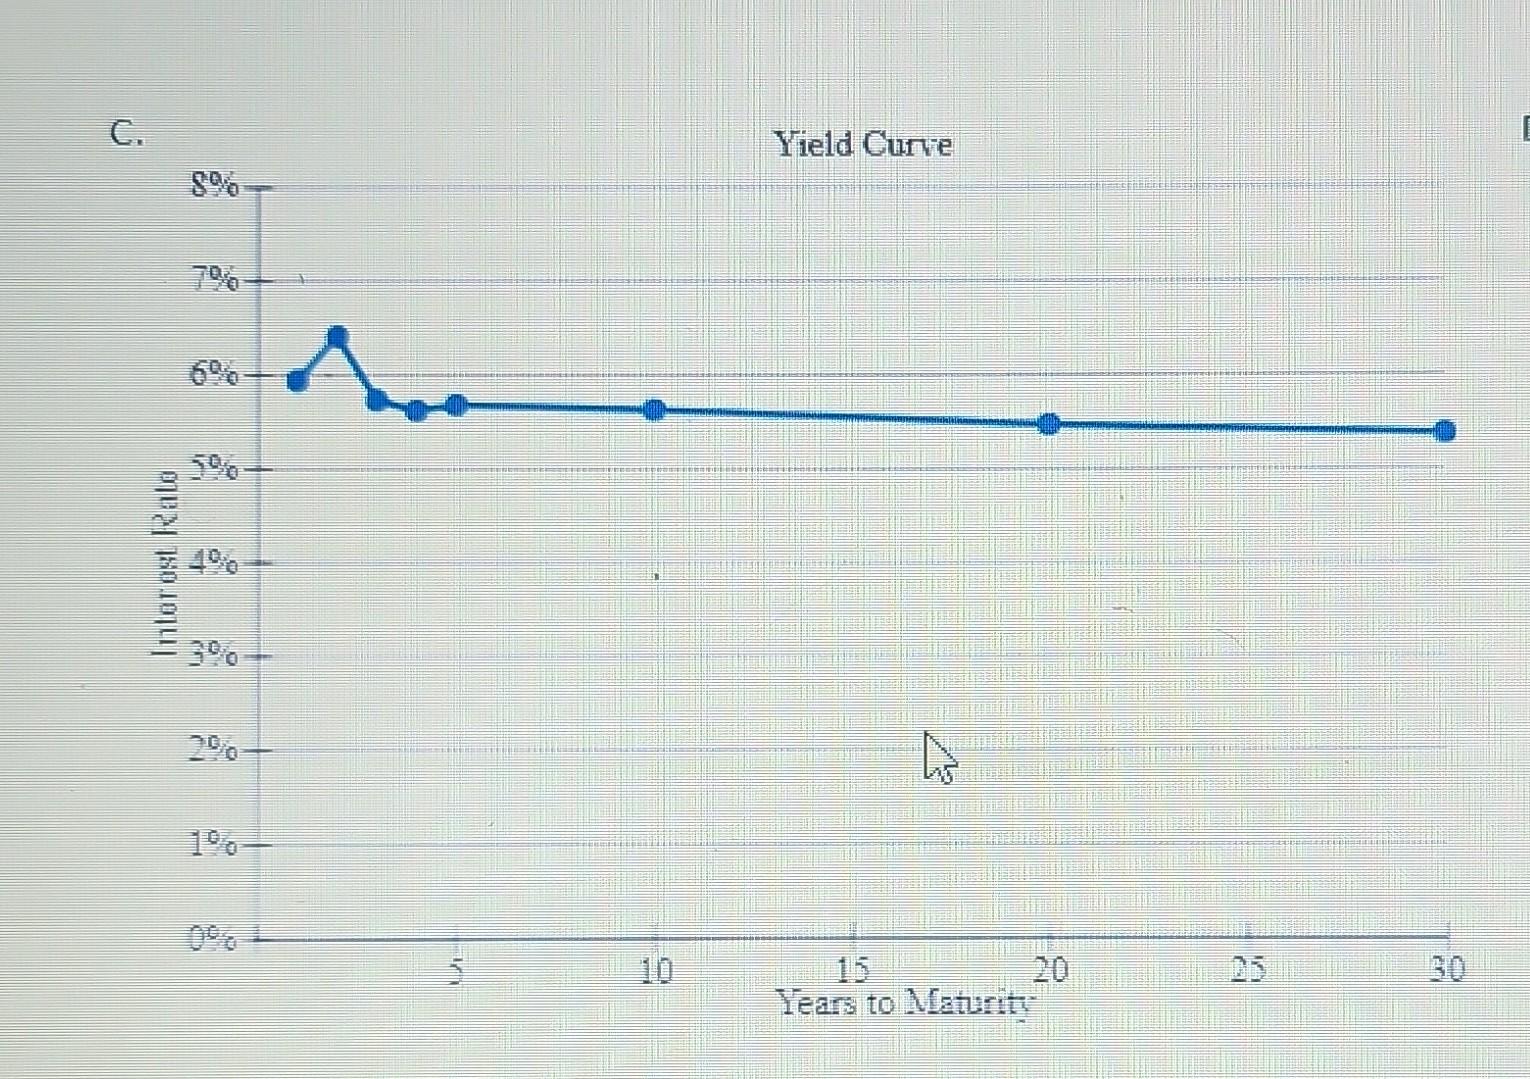
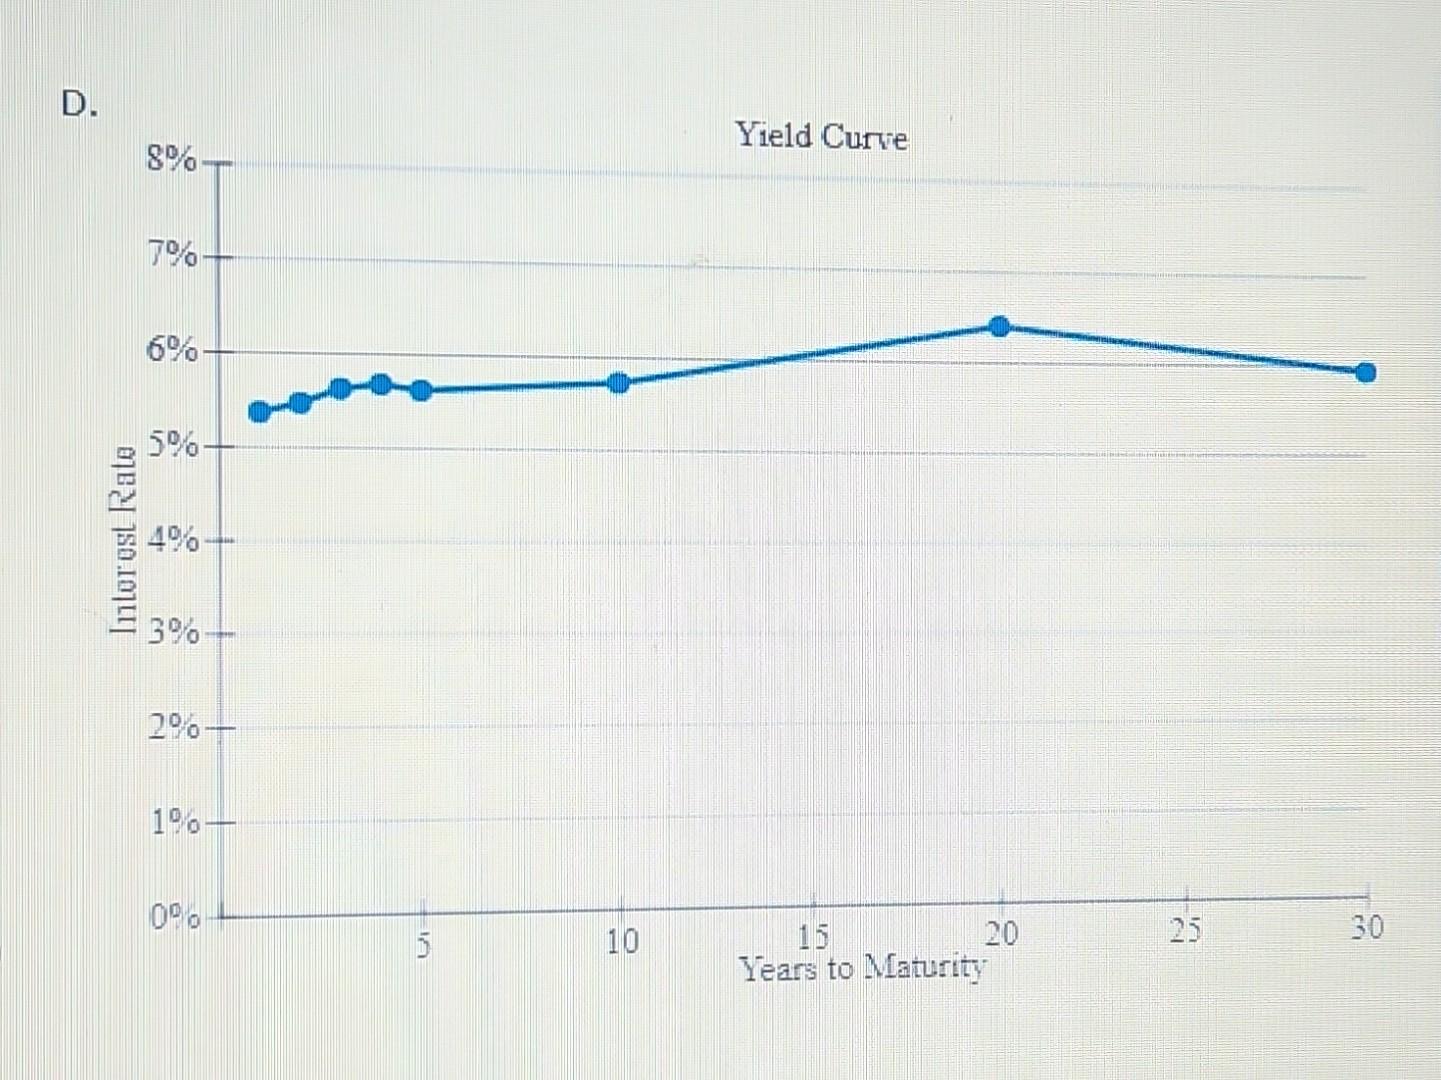
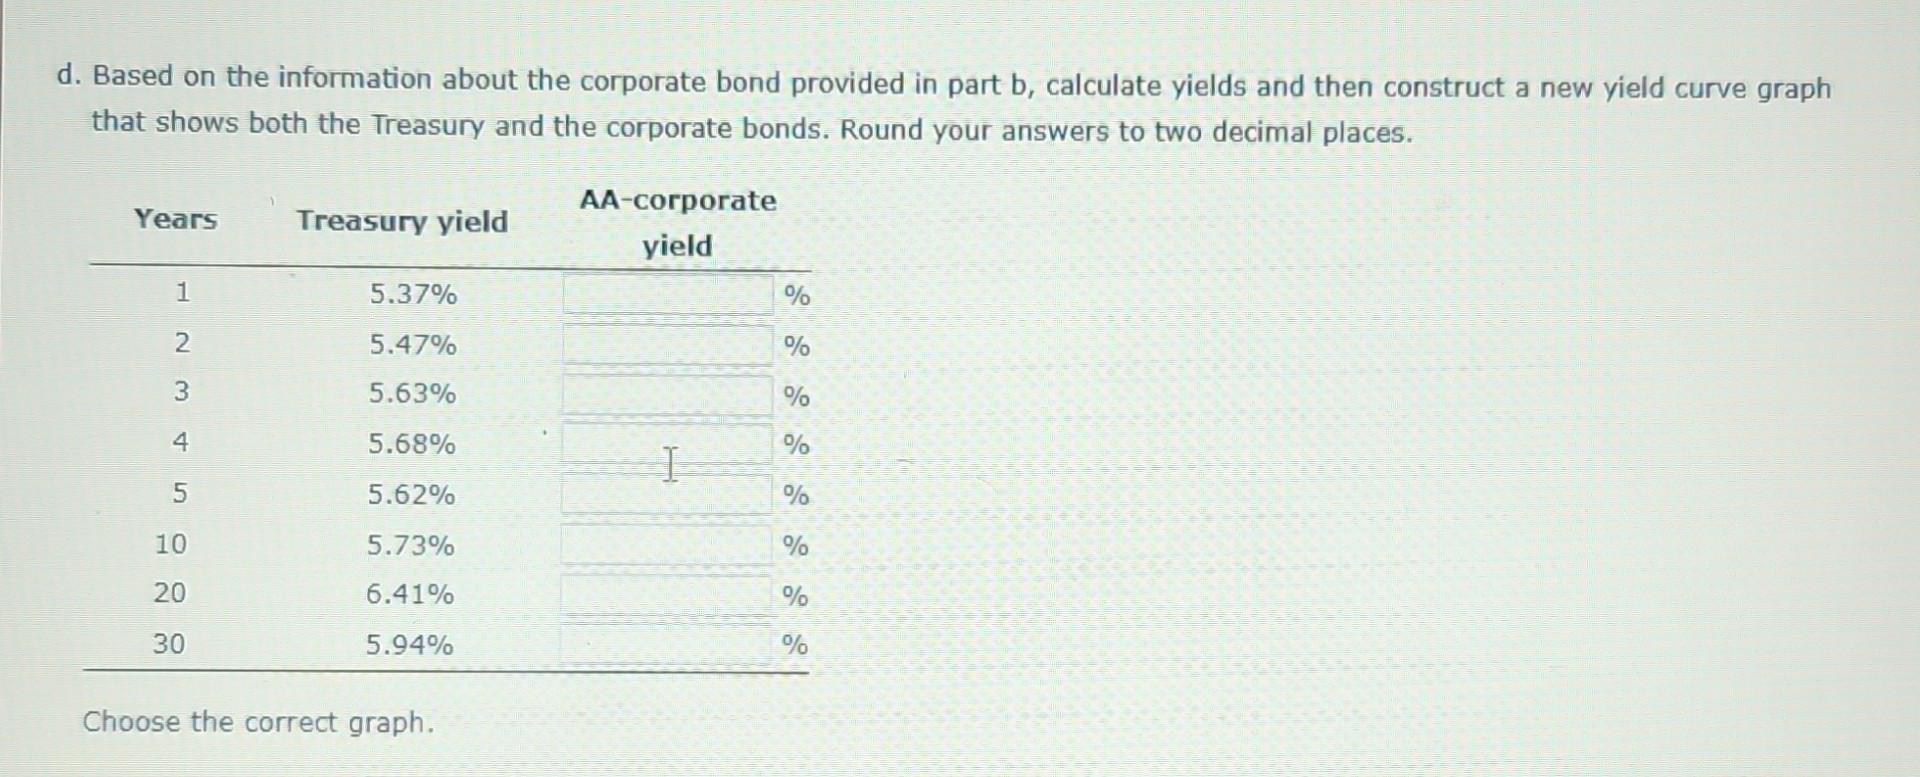
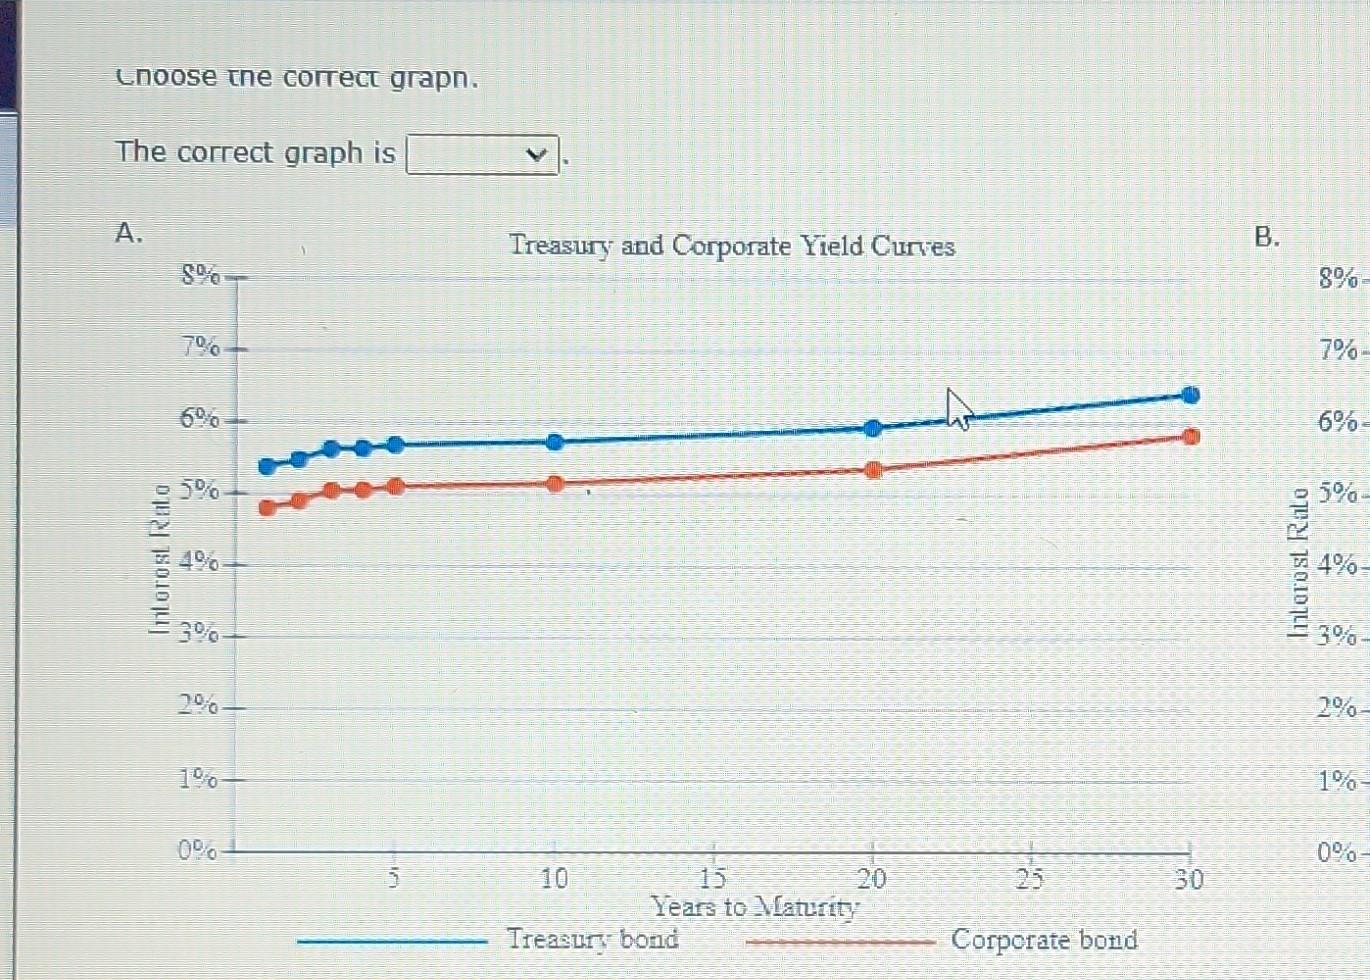
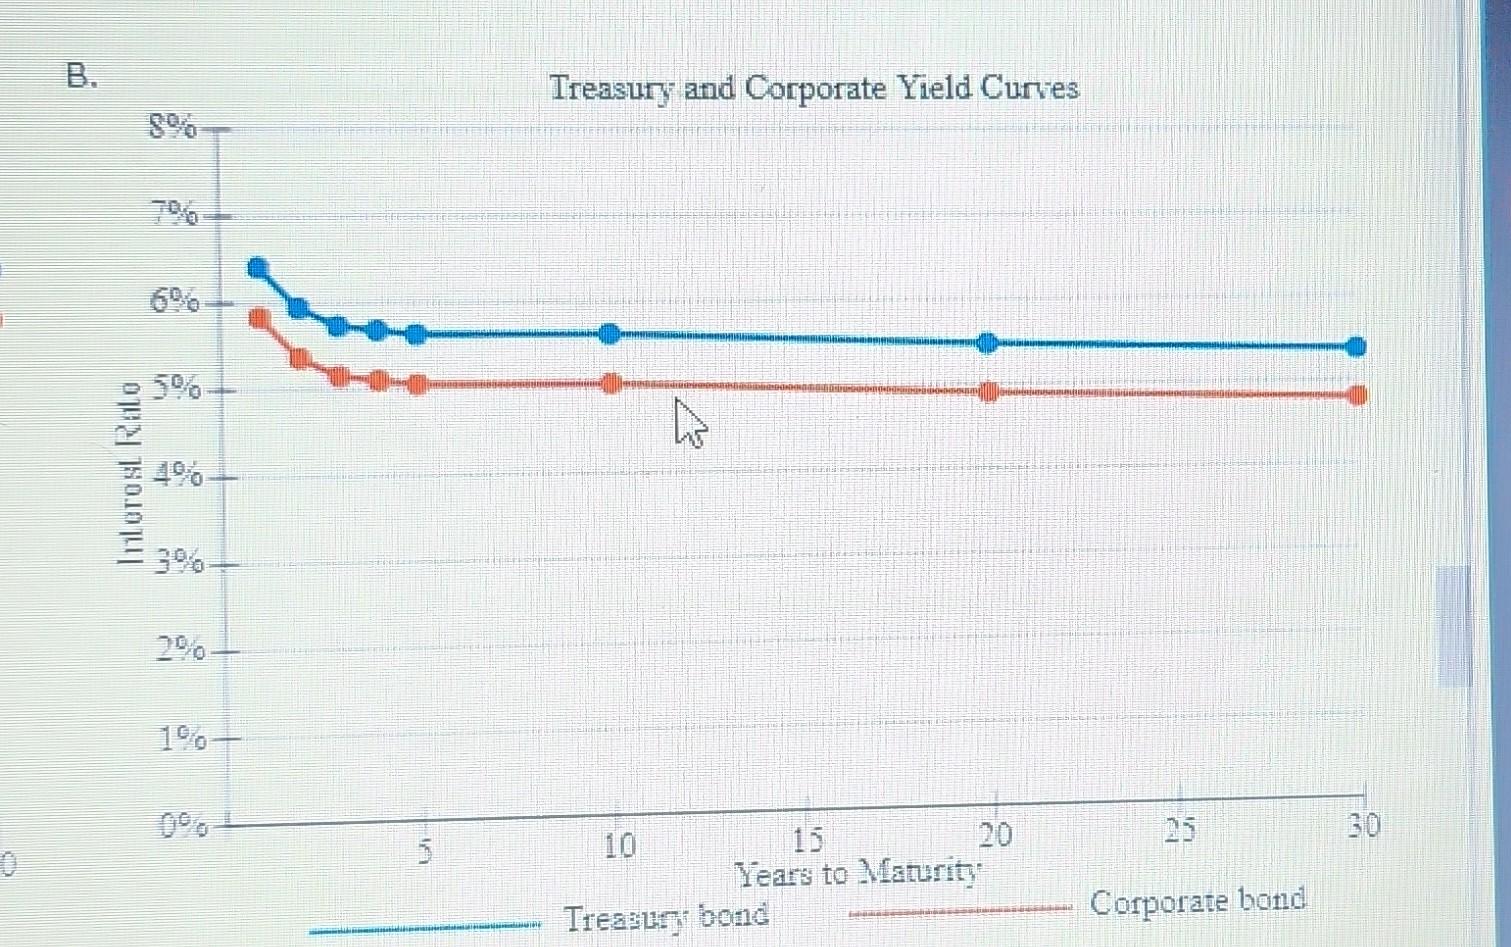
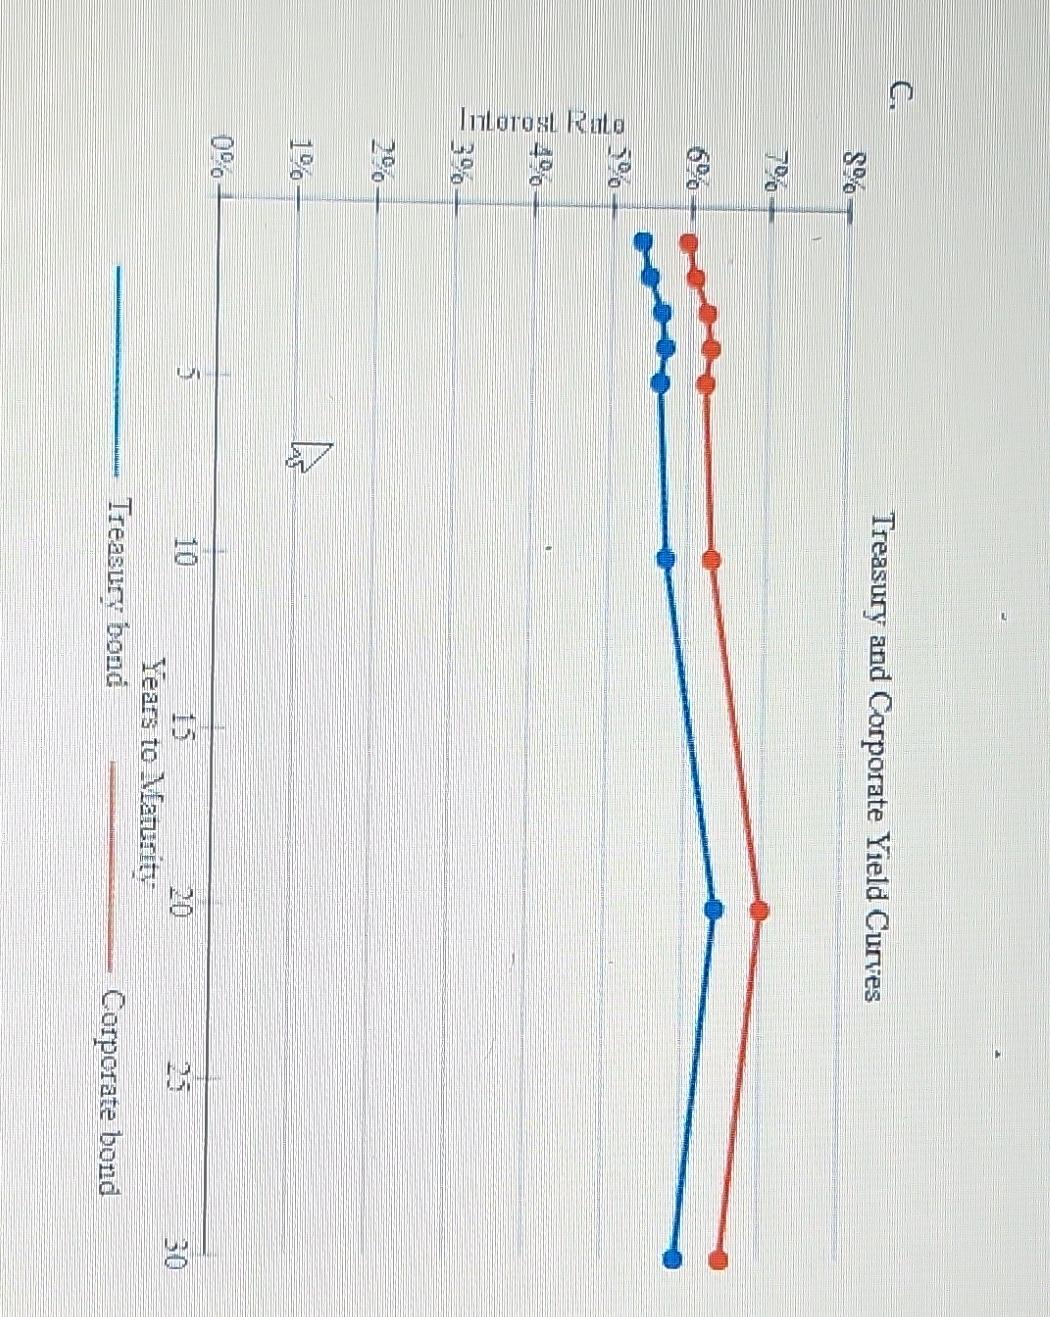
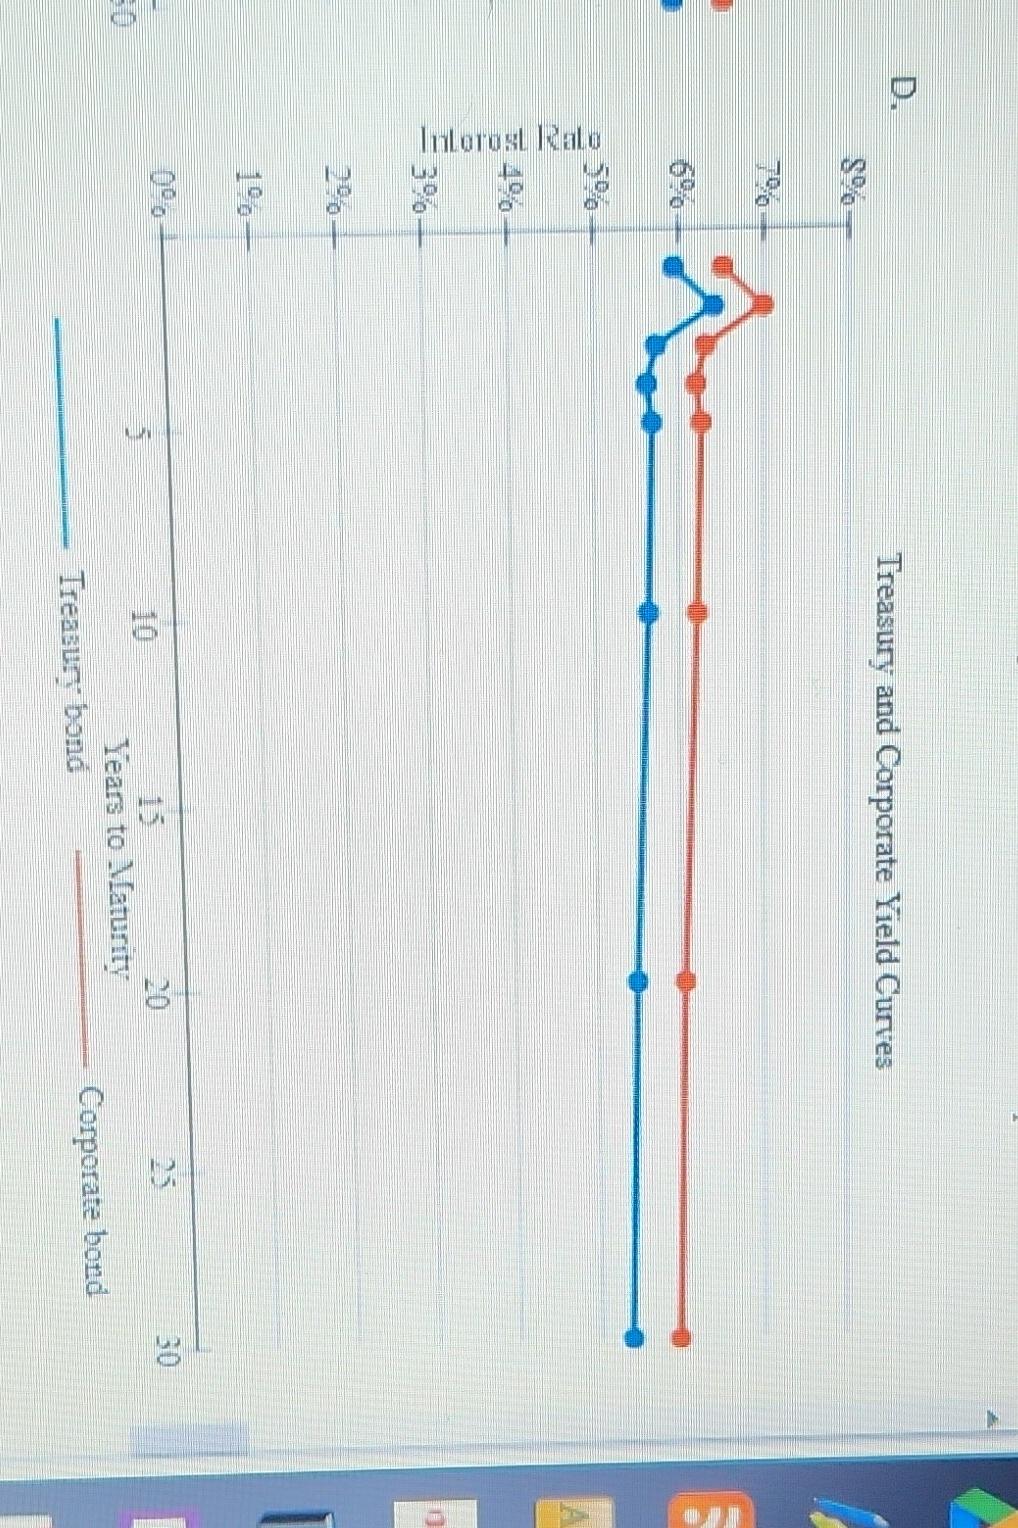
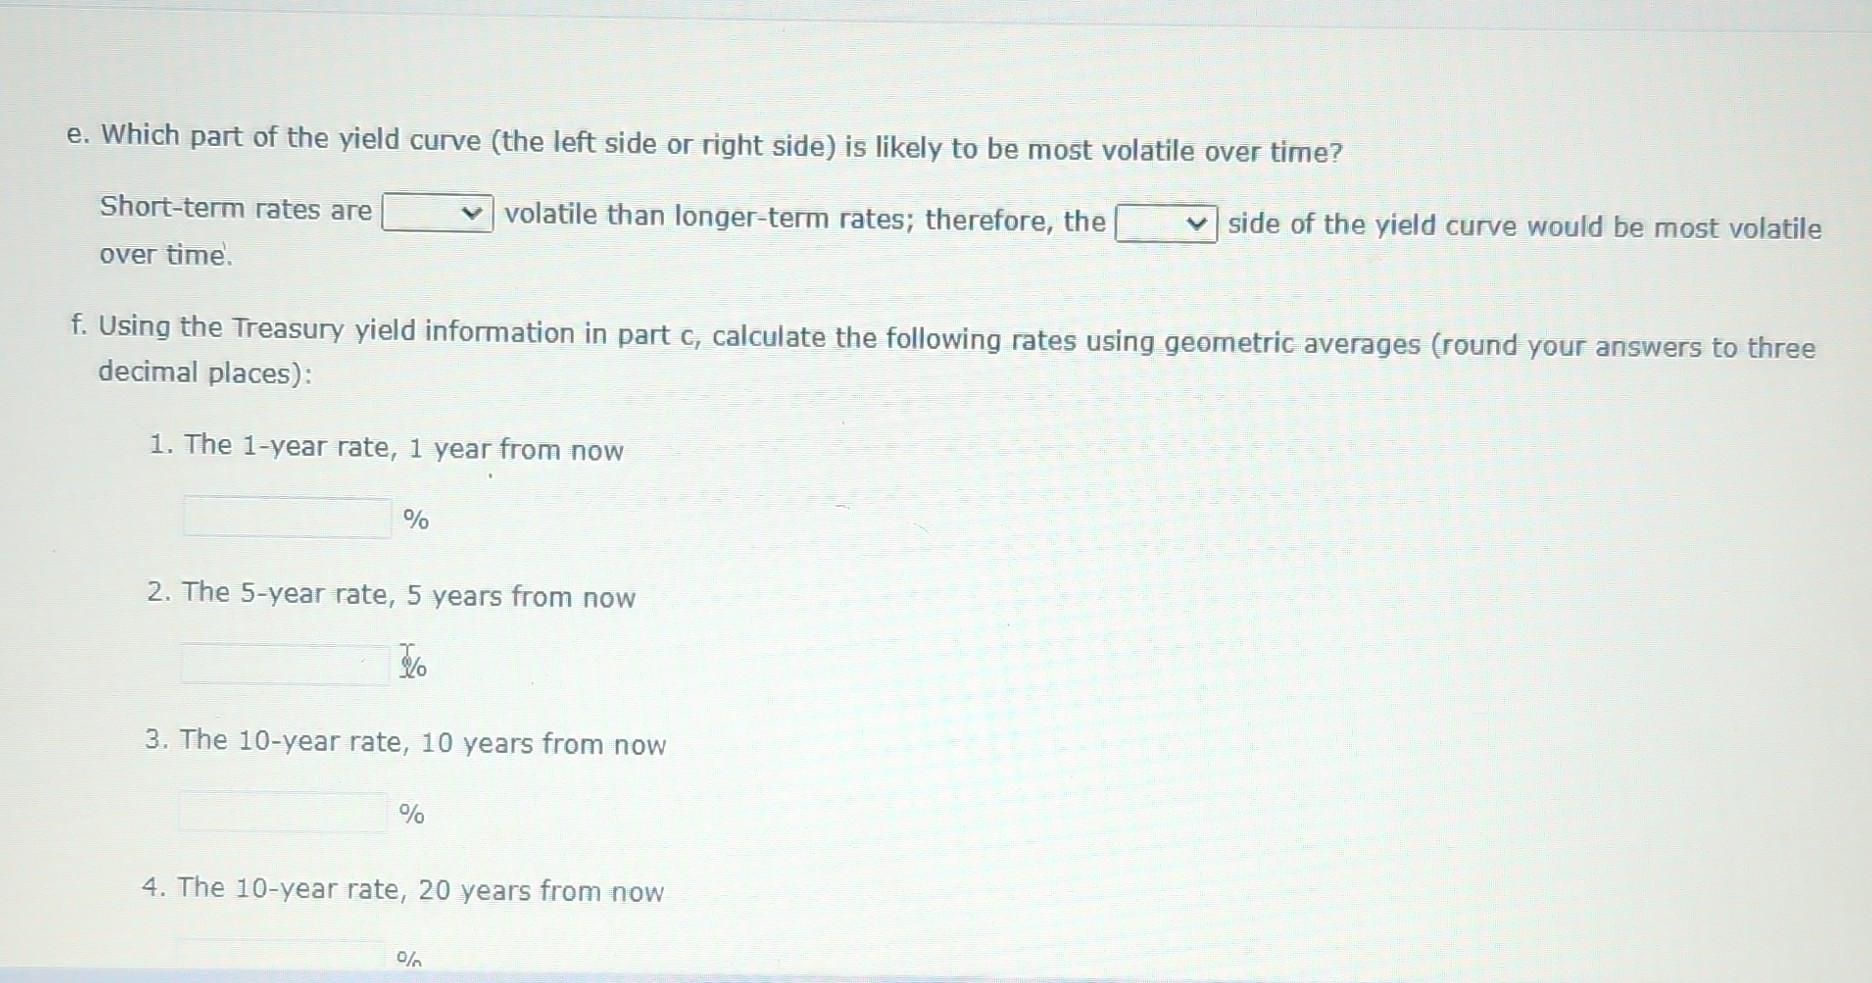
Excel Activity: Interest Rate Determination and Yield Curves The data has been collected in the Microsoft Excel file below. Download the spreadsheet and perform the required analysis to answer the questions below. Do not round intermediate calculations. Download spreadsheet Interest Rate Determination and Yield Curves-228d92.xlsx a. What effect would each of the following events likely have on the level of nominal interest rates? 1. Households dramatically increase their savings rate. This action will the supply of money; therefore, interest rates will 2. Corporations decrease their demand for funds following a decrease in investment opportunities. This action will cause interest rates to 3. The government runs a smaller-than-expected budget deficit. The smaller the federal deficit, other things held constant, the the level of interest rates. c. Constructing a graph of the yield curve Calculating yields and then constructing a new yield curve graph that shows both the Treasury and the corporate bonds D. Treasury and Corporate Yield Curves 96 f. Calculating the rates using geometric averages 97 (1) Calculating the 1 -year rate, 1 year from now 38 (2) Calculating the 5 year rate, 5 years from now 989 (3) Calculating the 10-year rate, 10 years from now (4) Calculating the 10-year rate, 20 years from now 4. There is an increase in expected inflation. This expectation will cause interest rates to b. Suppose you are considering two possible investment opportunities: a 12-year Treasury bond and a 7-year, AA-rated corporate bond. The current real risk-free rate is 3%, and inflation is expected to be 2% for the next 2 years, 3% for the following 4 years, and 4% thereafter. The maturity risk premium is estimated by this formula: MRP =0.01(t1)%. The liquidity premium (LP) for the corporate bond is estimated to be 0.2%. You may determine the default risk premium (DRP), given the company's bond rating, from the following table. Remember to subtract the bond's LP from the corporate spread given in the table to arrive at the bond's DRP. What yield would you predict for each of these two investments? Round your answers to three decimal places. 12-year Treasury yield: % cnoose the correct grapn. The correct graph is B. Yield Curve B. Treasury and Corporate Yield Curves c. Yield Curve What yield would you predict for each of these two investments? Round your answers to three decimal places. 12-year Treasury yield: % 7-year Corporate yield: % c. Given the following Treasury bond yield information, construct a graph of the yield curve. 1 Interest Rate Detemination and Vield Curves E b. Finding the yield for each of the two investments 4 Real nisk-free rate 5 Expected inflation 6 Expected inflation 7 Expected inflation thereafter 8 Maturity risk premium = 9 Liquidity premium III Maturity of treasury bond II Naturity of corporate bond 12 Comporate bond rating 13 14t 12 year Treasury Bond 15 Real riskifree rate is Inflation premium 1 . Maturity risk premium 18 12year Treasury yield 19 \begin{tabular}{|c|c|} \hline Rating & DRP+LP \\ \hline AAA & 0.20% \\ \hline 22AA & 0.58% \\ \hline 28 & 1.02% \\ \hline \end{tabular} 3% 2% for the next 3% for the followin 4% 0.01%(t1) 0.2% 12 years 7 years AA 2 years 4 years Formulas ANIA \#N/A =N/A d. Based on the information about the corporate bond provided in part b, calculate yields and then construct a new yield curve graph that shows both the Treasury and the corporate bonds. Round your answers to two decimal places. Choose the correct graph. D. The correct graph is 8% 7% 6% e. Which part of the yield curve (the left side or right side) is likely to be most volatile over time? Short-term rates are volatile than longer-term rates; therefore, the over time'. side of the yield curve would be most volatile f. Using the Treasury yield information in part c, calculate the following rates using geometric averages (round your answers to three decimal places): 1. The 1 -year rate, 1 year from now % 2. The 5-year rate, 5 years from now 3. The 10 -year rate, 10 years from now % 4. The 10-year rate, 20 years from now
Step by Step Solution
There are 3 Steps involved in it

Get step-by-step solutions from verified subject matter experts