

Question: Excel Assignment #1 I have created an assignment that requires you to use the time value of money concepts you have learned to help a
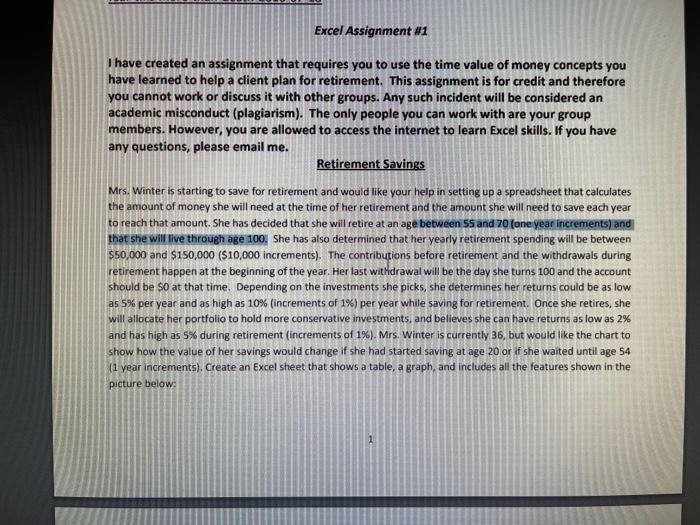
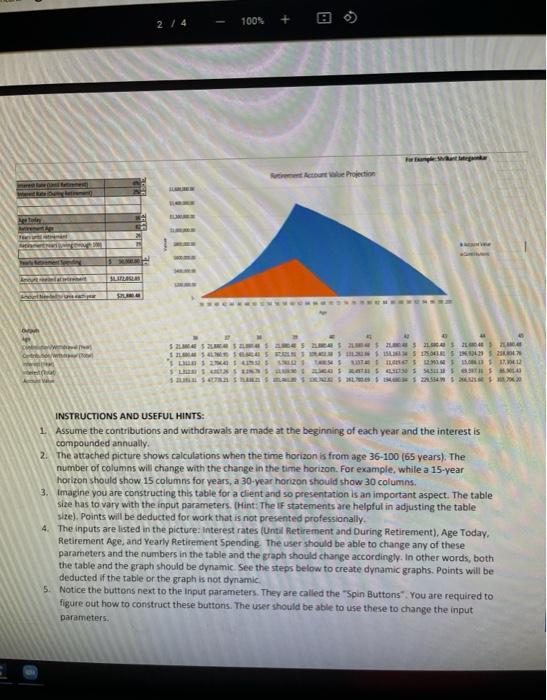
Excel Assignment #1 I have created an assignment that requires you to use the time value of money concepts you have learned to help a client plan for retirement. This assignment is for credit and therefore you cannot work or discuss it with other groups. Any such incident will be considered an academic misconduct (plagiarism). The only people you can work with are your group members. However, you are allowed to access the internet to learn Excel skills. If you have any questions, please email me. Retirement Savings Mrs. Winter is starting to save for retirement and would like your help in setting up a spreadsheet that calculates the amount of money she will need at the time of her retirement and the amount she will need to save each year to reach that amount. She has decided that she will retire at an age between 55 and 70 (one year increments) and that she will live through age 100. She has also determined that her yearly retirement spending will be between $50,000 and $150,000 ($10,000 increments). The contributions before retirement and the withdrawals during retirement happen at the beginning of the year. Her last withdrawal will be the day she turns 100 and the account should be so at that time. Depending on the investments she picks, she determines her returns could be as low as 5% per year and as high as 10% (increments of 1%) per year while saving for retirement. Once she retires, she will allocate her portfolio to hold more conservative investments, and believes she can have returns as low as 2% and has high as 5% during retirement (increments of 1%). Mrs. Winter is currently 36, but would like the chart to show how the value of her savings would change if she had started saving at age 20 or if she waited until age 54 (1 year increments). Create an Excel sheet that shows a table, a graph, and includes all the features shown in the picture below: 100% + 2 / 4 a want Atent Projection SLR w 525 LES DES GAS 2 1 ILS SN 1 SIDERS IN 'Os LITE SLX 50S SS BLO INSTRUCTIONS AND USEFUL HINTS: 1 Assume the contributions and withdrawals are made at the beginning of each year and the interest is compounded annually 2. The attached picture shows calculations when the time horizon is from age 36-100 (65 years). The number of columns will change with the change in the time horizon. For example, while a 15-year horizon should show 15 columns for years, a 30-year horizon should show 30 columns 3. Imagine you are constructing this table for a client and so presentation is an important aspect. The table size has to vary with the input parameters. (Hint: The IF statements are helpful in adjusting the table size). Points will be deducted for work that is not presented professionally. 4. The inputs are listed in the picture: interest rates (Until Retirement and During Retirement), Age Today. Retirement Age, and Yearly Retirement Spending the user should be able to change any of these parameters and the numbers in the table and the graph should change accordingly. In other words, both the table and the graph should be dynamic See the steps below to create dynamic graphs. Points will be deducted if the table or the graph is not dynamic 5. Notice the buttons next to the input parameters. They are called the "Spin Buttons" You are required to figure out how to construct these buttons. The user should be able to use these to change the input parameters Excel Assignment #1 I have created an assignment that requires you to use the time value of money concepts you have learned to help a client plan for retirement. This assignment is for credit and therefore you cannot work or discuss it with other groups. Any such incident will be considered an academic misconduct (plagiarism). The only people you can work with are your group members. However, you are allowed to access the internet to learn Excel skills. If you have any questions, please email me. Retirement Savings Mrs. Winter is starting to save for retirement and would like your help in setting up a spreadsheet that calculates the amount of money she will need at the time of her retirement and the amount she will need to save each year to reach that amount. She has decided that she will retire at an age between 55 and 70 (one year increments) and that she will live through age 100. She has also determined that her yearly retirement spending will be between $50,000 and $150,000 ($10,000 increments). The contributions before retirement and the withdrawals during retirement happen at the beginning of the year. Her last withdrawal will be the day she turns 100 and the account should be so at that time. Depending on the investments she picks, she determines her returns could be as low as 5% per year and as high as 10% (increments of 1%) per year while saving for retirement. Once she retires, she will allocate her portfolio to hold more conservative investments, and believes she can have returns as low as 2% and has high as 5% during retirement (increments of 1%). Mrs. Winter is currently 36, but would like the chart to show how the value of her savings would change if she had started saving at age 20 or if she waited until age 54 (1 year increments). Create an Excel sheet that shows a table, a graph, and includes all the features shown in the picture below: 100% + 2 / 4 a want Atent Projection SLR w 525 LES DES GAS 2 1 ILS SN 1 SIDERS IN 'Os LITE SLX 50S SS BLO INSTRUCTIONS AND USEFUL HINTS: 1 Assume the contributions and withdrawals are made at the beginning of each year and the interest is compounded annually 2. The attached picture shows calculations when the time horizon is from age 36-100 (65 years). The number of columns will change with the change in the time horizon. For example, while a 15-year horizon should show 15 columns for years, a 30-year horizon should show 30 columns 3. Imagine you are constructing this table for a client and so presentation is an important aspect. The table size has to vary with the input parameters. (Hint: The IF statements are helpful in adjusting the table size). Points will be deducted for work that is not presented professionally. 4. The inputs are listed in the picture: interest rates (Until Retirement and During Retirement), Age Today. Retirement Age, and Yearly Retirement Spending the user should be able to change any of these parameters and the numbers in the table and the graph should change accordingly. In other words, both the table and the graph should be dynamic See the steps below to create dynamic graphs. Points will be deducted if the table or the graph is not dynamic 5. Notice the buttons next to the input parameters. They are called the "Spin Buttons" You are required to figure out how to construct these buttons. The user should be able to use these to change the input parameters
Step by Step Solution
There are 3 Steps involved in it

Get step-by-step solutions from verified subject matter experts