Question: Excel Assignment #1 Project Description: You own a small real estate company in Kokomo. You track the real estate properties you list for clients. You
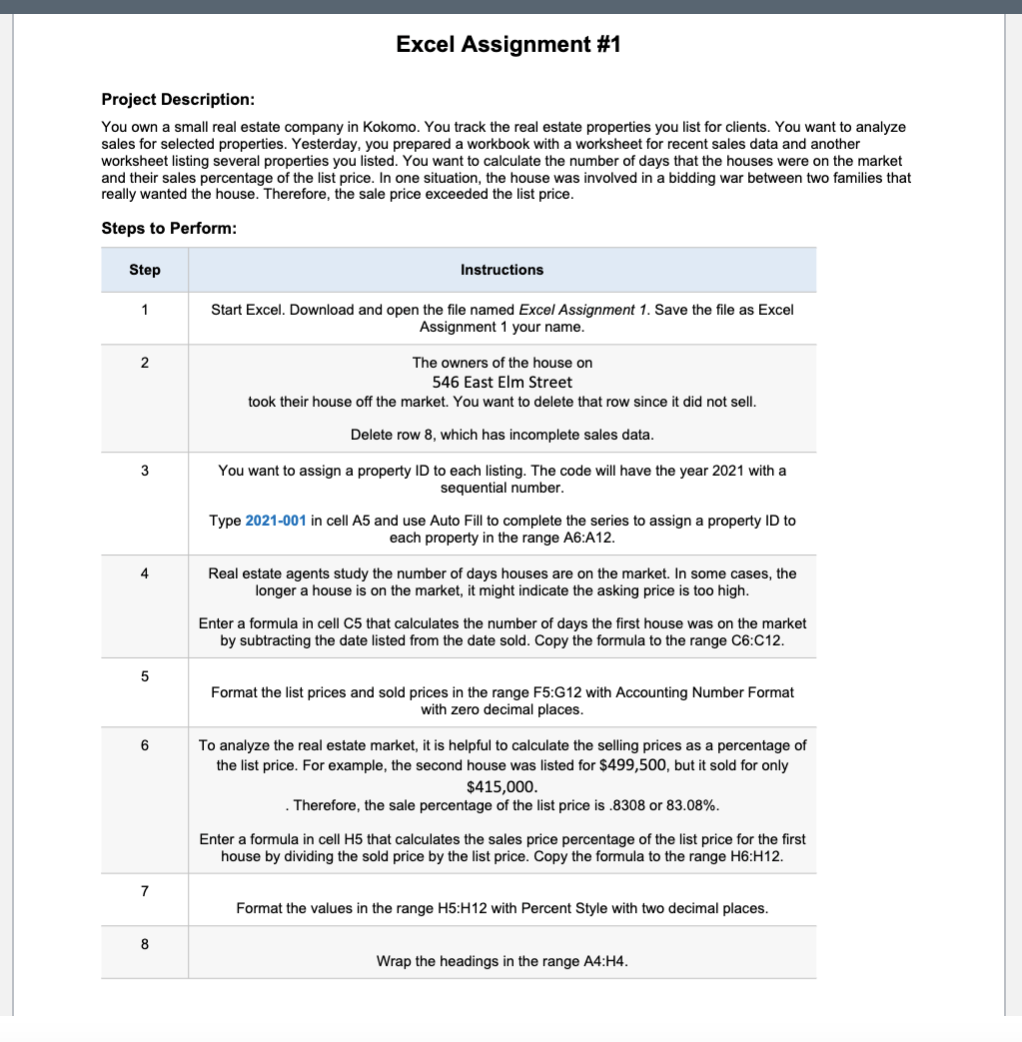
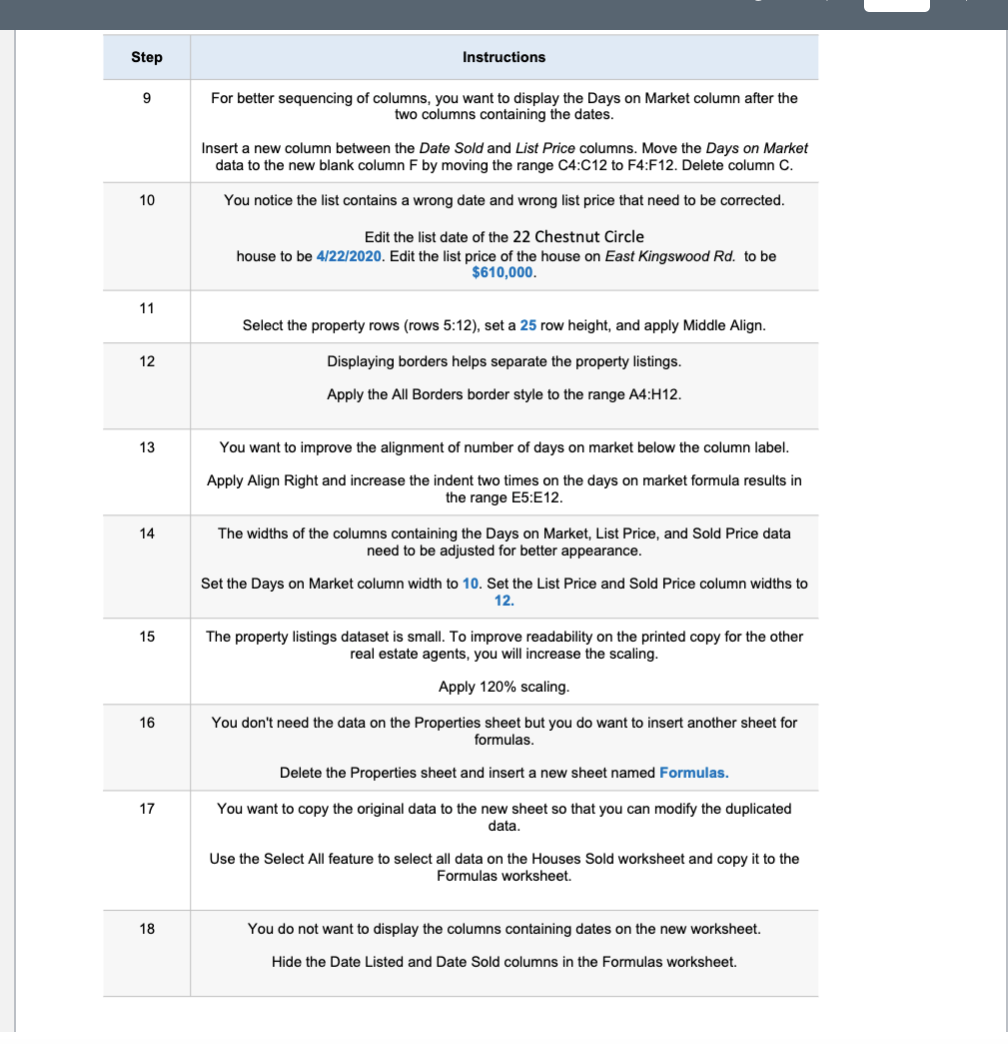
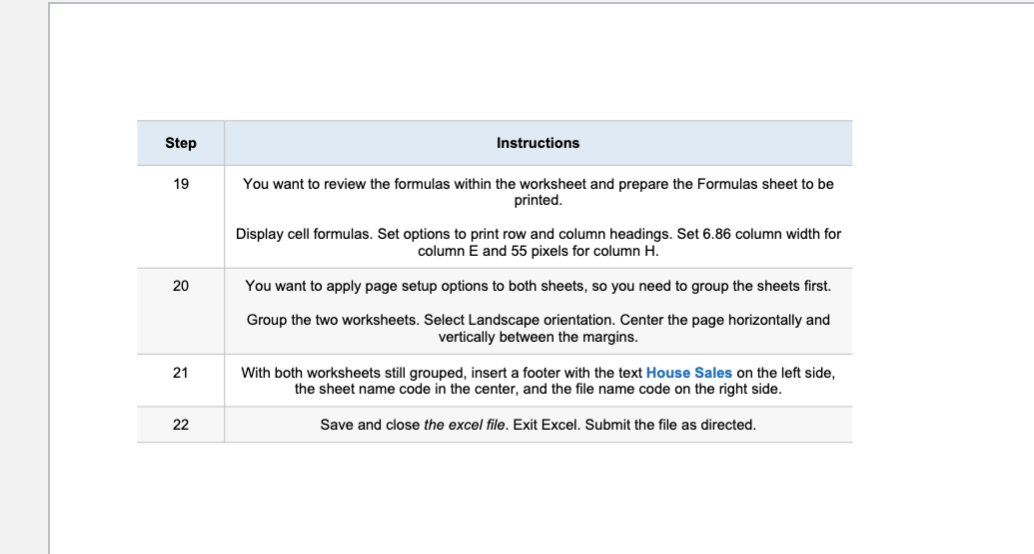
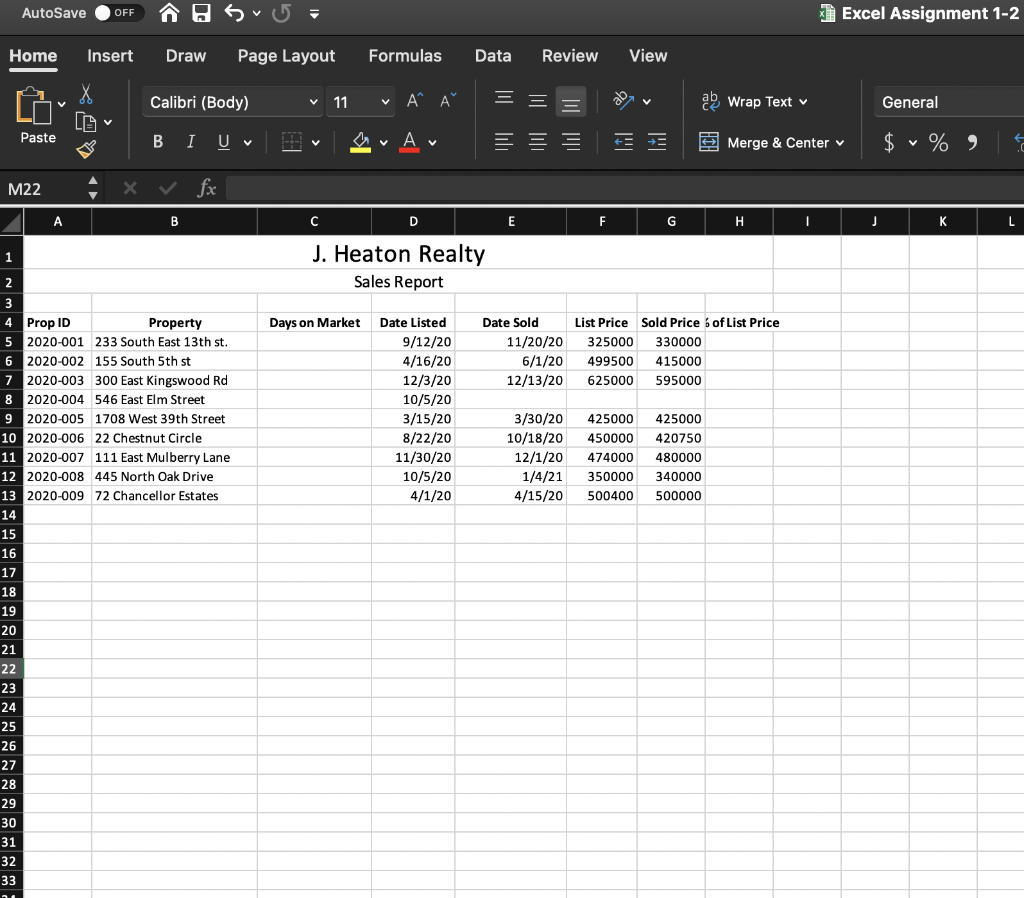
Excel Assignment #1 Project Description: You own a small real estate company in Kokomo. You track the real estate properties you list for clients. You want to analyze sales for selected properties. Yesterday, you prepared a workbook with a worksheet for recent sales data and another worksheet listing several properties you listed. You want to calculate the number of days that the houses were on the market and their sales percentage of the list price. In one situation, the house was involved in a bidding war between two families that really wanted the house. Therefore, the sale price exceeded the list price. Steps to Perform: Step Instructions 1 Start Excel. Download and open the file named Excel Assignment 1. Save the file as Excel Assignment 1 your name. 2 The owners of the house on 546 East Elm Street took their house off the market. You want to delete that row since it did not sell. Delete row 8, which has incomplete sales data. 3 You want to assign a property ID to each listing. The code will have the year 2021 with a sequential number. Type 2021-001 in cell A5 and use Auto Fill to complete the series to assign a property ID to each property in the range A6:A12. Real estate agents study the number of days houses are on the market. In some cases, the longer a house is on the market, it might indicate the asking price is too high. Enter a formula in cell C5 that calculates the number of days the first house was on the market by subtracting the date listed from the date sold. Copy the formula to the range C6:C12. 5 Format the list prices and sold prices in the range F5:G12 with Accounting Number Format with zero decimal places. 6 To analyze the real estate market, it is helpful to calculate the selling prices as a percentage of the list price. For example, the second house was listed for $499,500, but it sold for only $415,000. Therefore, the sale percentage of the list price is .8308 or 83.08%. Enter a formula in cell H5 that calculates the sales price percentage of the list price for the first house by dividing the sold price by the list price. Copy the formula to the range H6:H12. 7 Format the values in the range H5:H12 with Percent Style with two decimal places. 8 Wrap the headings in the range A4:44. Step Instructions 9 For better sequencing of columns, you want to display the Days on Market column after the two columns containing the dates. Insert a new column between the Date Sold and List Price columns. Move the Days on Market data to the new blank column F by moving the range C4:C12 to F4:F12. Delete column C. 10 You notice the list contains a wrong date and wrong list price that need to be corrected. Edit the list date of the 22 Chestnut Circle house to be 4/22/2020. Edit the list price of the house on East Kingswood Rd. to be $610,000. 11 Select the property rows (rows 5:12), set a 25 row height, and apply Middle Align. 12 Displaying borders helps separate the property listings. Apply the All Borders border style to the range A4:H12. 13 You want to improve the alignment of number of days on market below the column label. Apply Align Right and increase the indent two times on the days on market formula results in the range E5:E12. 14 The widths of the columns containing the Days on Market, List Price, and Sold Price data need to be adjusted for better appearance. Set the Days on Market column width to 10. Set the List Price and Sold Price column widths to 12. 15 The property listings dataset is small. To improve readability on the printed copy for the other real estate agents, you will increase the scaling. Apply 120% scaling. 16 You don't need the data on the Properties sheet but you do want to insert another sheet for formulas. Delete the Properties sheet and insert a new sheet named Formulas. 17 You want to copy the original data to the new sheet so that you can modify the duplicated data. Use the Select All feature to select all data on the Houses Sold worksheet and copy it to the Formulas worksheet. 18 You do not want to display the columns containing dates on the new worksheet. Hide the Date Listed and Date Sold columns in the Formulas worksheet. Step Instructions 19 You want to review the formulas within the worksheet and prepare the Formulas sheet to be printed Display cell formulas. Set options to print row and column headings. Set 6.86 column width for column E and 55 pixels for column H. 20 You want to apply page setup options to both sheets, so you need to group the sheets first. Group the two worksheets. Select Landscape orientation Center the page horizontally and vertically between the margins. 21 With both worksheets still grouped, insert a footer with the text House Sales on the left side, the sheet name code in the center, and the file name code on the right side. 22 Save and close the excel file. Exit Excel. Submit the file as directed. AutoSave OFF Excel Assignment 1-2 Home Insert Draw Page Layout Formulas Data Review View Calibri (Body) v 11 X LG A ab Wrap Text General Paste B I UV A v + + Merge & Center v $ % M22 x fx B C D E F G H J L 1 J. Heaton Realty Sales Report 2 Days on Market Date Sold 11/20/20 6/1/20 12/13/20 List Price Sold Price 6 of List Price 325000 330000 499500 415000 625000 595000 Date Listed 9/12/20 4/16/20 12/3/20 10/5/20 3/15/20 8/22/20 11/30/20 10/5/20 4/1/20 3/30/20 10/18/20 12/1/20 1/4/21 4/15/20 425000 450000 474000 350000 500400 425000 420750 480000 340000 500000 4 Prop ID Property 5 2020-001 233 South East 13th st. 6 2020-002 155 South 5th st 7 2020-003 300 East Kingswood Rd 8 2020-004 546 East Elm Street 9 2020-005 1708 West 39th Street 10 2020-006 22 Chestnut Circle 11 2020-007 111 East Mulberry Lane 12 2020-008 445 North Oak Drive 13 2020-009 72 Chancellor Estates 14 15 16 17 18 19 20 21 22 23 24 25 26 27 28 29 30 31 32 33 . AutoSave OFF Sv= Excel Assignment 1-2 Home Insert Draw Page Layout Formulas Data Review View Calibri (Body) V 11 V AA ab Wrap Text General Paste v E E Merge & Center $ v % A9 X fx 72 Chancellor Estates A B D E F G J K L M N 1 233 South East 13th st. 2 155 South 5th st 3 300 East Kingswood Rd 4 546 East Elm Street 5 1708 West 39th Street 6 22 Chestnut Circle 7 111 East Mulberry Lane 8 445 North Oak Drive 9 72 Chancellor Estates 10 621 Vintage Road 11 521 North Vestry 12 36 North Vestry 13 14 15 16 17 18 19 20 21 22 23 24 25 26 27 Excel Assignment #1 Project Description: You own a small real estate company in Kokomo. You track the real estate properties you list for clients. You want to analyze sales for selected properties. Yesterday, you prepared a workbook with a worksheet for recent sales data and another worksheet listing several properties you listed. You want to calculate the number of days that the houses were on the market and their sales percentage of the list price. In one situation, the house was involved in a bidding war between two families that really wanted the house. Therefore, the sale price exceeded the list price. Steps to Perform: Step Instructions 1 Start Excel. Download and open the file named Excel Assignment 1. Save the file as Excel Assignment 1 your name. 2 The owners of the house on 546 East Elm Street took their house off the market. You want to delete that row since it did not sell. Delete row 8, which has incomplete sales data. 3 You want to assign a property ID to each listing. The code will have the year 2021 with a sequential number. Type 2021-001 in cell A5 and use Auto Fill to complete the series to assign a property ID to each property in the range A6:A12. Real estate agents study the number of days houses are on the market. In some cases, the longer a house is on the market, it might indicate the asking price is too high. Enter a formula in cell C5 that calculates the number of days the first house was on the market by subtracting the date listed from the date sold. Copy the formula to the range C6:C12. 5 Format the list prices and sold prices in the range F5:G12 with Accounting Number Format with zero decimal places. 6 To analyze the real estate market, it is helpful to calculate the selling prices as a percentage of the list price. For example, the second house was listed for $499,500, but it sold for only $415,000. Therefore, the sale percentage of the list price is .8308 or 83.08%. Enter a formula in cell H5 that calculates the sales price percentage of the list price for the first house by dividing the sold price by the list price. Copy the formula to the range H6:H12. 7 Format the values in the range H5:H12 with Percent Style with two decimal places. 8 Wrap the headings in the range A4:44. Step Instructions 9 For better sequencing of columns, you want to display the Days on Market column after the two columns containing the dates. Insert a new column between the Date Sold and List Price columns. Move the Days on Market data to the new blank column F by moving the range C4:C12 to F4:F12. Delete column C. 10 You notice the list contains a wrong date and wrong list price that need to be corrected. Edit the list date of the 22 Chestnut Circle house to be 4/22/2020. Edit the list price of the house on East Kingswood Rd. to be $610,000. 11 Select the property rows (rows 5:12), set a 25 row height, and apply Middle Align. 12 Displaying borders helps separate the property listings. Apply the All Borders border style to the range A4:H12. 13 You want to improve the alignment of number of days on market below the column label. Apply Align Right and increase the indent two times on the days on market formula results in the range E5:E12. 14 The widths of the columns containing the Days on Market, List Price, and Sold Price data need to be adjusted for better appearance. Set the Days on Market column width to 10. Set the List Price and Sold Price column widths to 12. 15 The property listings dataset is small. To improve readability on the printed copy for the other real estate agents, you will increase the scaling. Apply 120% scaling. 16 You don't need the data on the Properties sheet but you do want to insert another sheet for formulas. Delete the Properties sheet and insert a new sheet named Formulas. 17 You want to copy the original data to the new sheet so that you can modify the duplicated data. Use the Select All feature to select all data on the Houses Sold worksheet and copy it to the Formulas worksheet. 18 You do not want to display the columns containing dates on the new worksheet. Hide the Date Listed and Date Sold columns in the Formulas worksheet. Step Instructions 19 You want to review the formulas within the worksheet and prepare the Formulas sheet to be printed Display cell formulas. Set options to print row and column headings. Set 6.86 column width for column E and 55 pixels for column H. 20 You want to apply page setup options to both sheets, so you need to group the sheets first. Group the two worksheets. Select Landscape orientation Center the page horizontally and vertically between the margins. 21 With both worksheets still grouped, insert a footer with the text House Sales on the left side, the sheet name code in the center, and the file name code on the right side. 22 Save and close the excel file. Exit Excel. Submit the file as directed. AutoSave OFF Excel Assignment 1-2 Home Insert Draw Page Layout Formulas Data Review View Calibri (Body) v 11 X LG A ab Wrap Text General Paste B I UV A v + + Merge & Center v $ % M22 x fx B C D E F G H J L 1 J. Heaton Realty Sales Report 2 Days on Market Date Sold 11/20/20 6/1/20 12/13/20 List Price Sold Price 6 of List Price 325000 330000 499500 415000 625000 595000 Date Listed 9/12/20 4/16/20 12/3/20 10/5/20 3/15/20 8/22/20 11/30/20 10/5/20 4/1/20 3/30/20 10/18/20 12/1/20 1/4/21 4/15/20 425000 450000 474000 350000 500400 425000 420750 480000 340000 500000 4 Prop ID Property 5 2020-001 233 South East 13th st. 6 2020-002 155 South 5th st 7 2020-003 300 East Kingswood Rd 8 2020-004 546 East Elm Street 9 2020-005 1708 West 39th Street 10 2020-006 22 Chestnut Circle 11 2020-007 111 East Mulberry Lane 12 2020-008 445 North Oak Drive 13 2020-009 72 Chancellor Estates 14 15 16 17 18 19 20 21 22 23 24 25 26 27 28 29 30 31 32 33 . AutoSave OFF Sv= Excel Assignment 1-2 Home Insert Draw Page Layout Formulas Data Review View Calibri (Body) V 11 V AA ab Wrap Text General Paste v E E Merge & Center $ v % A9 X fx 72 Chancellor Estates A B D E F G J K L M N 1 233 South East 13th st. 2 155 South 5th st 3 300 East Kingswood Rd 4 546 East Elm Street 5 1708 West 39th Street 6 22 Chestnut Circle 7 111 East Mulberry Lane 8 445 North Oak Drive 9 72 Chancellor Estates 10 621 Vintage Road 11 521 North Vestry 12 36 North Vestry 13 14 15 16 17 18 19 20 21 22 23 24 25 26 27


