

Question: Excel Assignment Clipboar u A2 G D H B C 2020 $50 0 500 1,000 $1,550 2,000 $3,550 2019 $60 40 380 820 $1,300 1,700
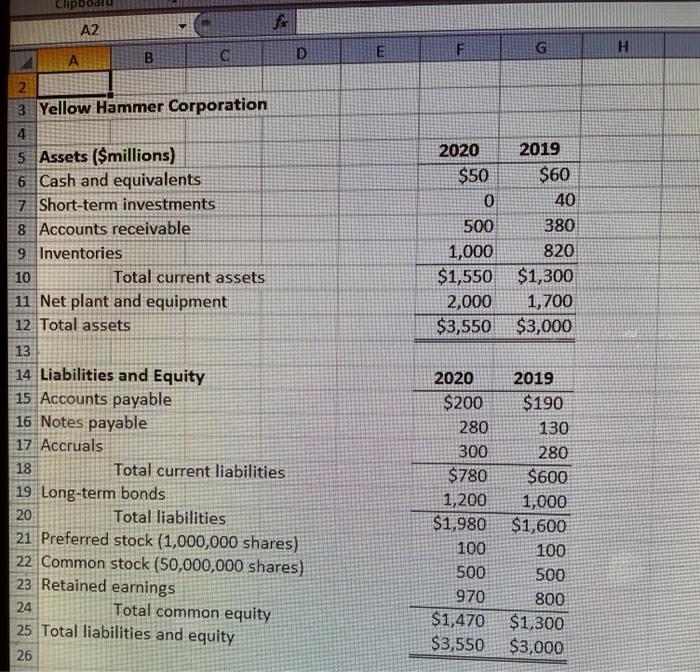
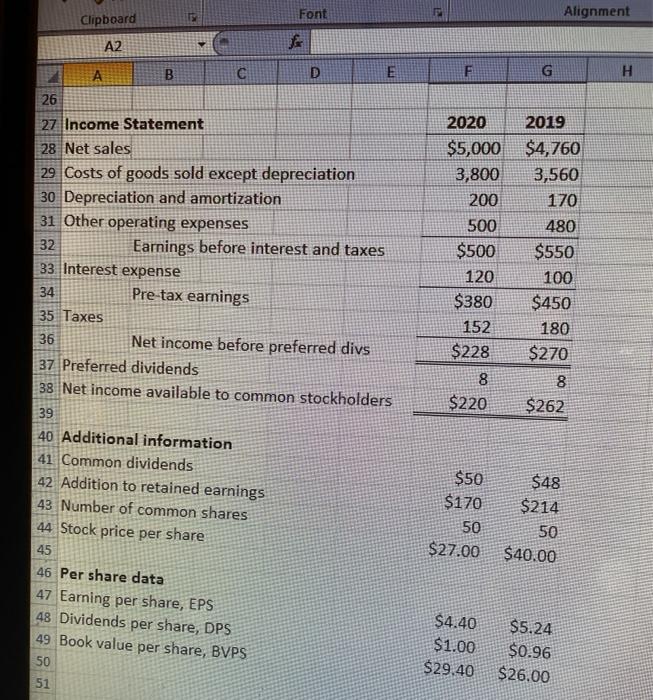
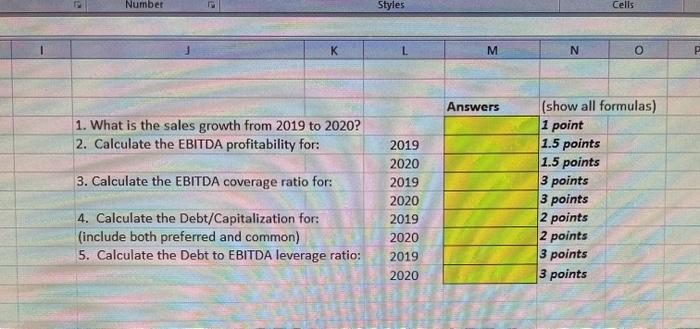
Clipboar u A2 G D H B C 2020 $50 0 500 1,000 $1,550 2,000 $3,550 2019 $60 40 380 820 $1,300 1,700 $3,000 2 3 Yellow Hammer Corporation 4 5 Assets ($millions) 6 Cash and equivalents 7 Short-term investments 8 Accounts receivable 9 Inventories 10 Total current assets 11 Net plant and equipment 12 Total assets 13 14 Liabilities and Equity 15 Accounts payable 16 Notes payable 17 Accruals 18 Total current liabilities 19 Long-term bonds 20 Total liabilities 21 Preferred stock (1,000,000 shares) 22 Common stock (50,000,000 shares) 23 Retained earnings 24 Total common equity 25 Total liabilities and equity 26 2020 2019 $200 $190 280 130 300 280 $780 $600 1,200 1,000 $1,980 $1,600 100 100 500 500 970 800 $1,470 $1,300 $3,550 $3,000 Clipboard Font Alignment A2 B G H . 26 27 Income Statement 28 Net sales 29 Costs of goods sold except depreciation 30 Depreciation and amortization 31 Other operating expenses 32 Earnings before interest and taxes 33. Interest expense 34 Pre tax earnings 35 Taxes 36 Net income before preferred divs 37 Preferred dividends 38 Net income available to common stockholders 39 40 Additional information 41 Common dividends 42 Addition to retained earnings 43 Number of common shares 44 Stock price per share 2020 2019 $ $5,000 $4,760 3,800 3,560 200 170 500 480 $500 $550 120 100 $380 $450 152 180 $228 $270 8 8 $220 $262 $48 $214 $50 $170 50 $27.00 50 45 $40.00 46 Per share data 47 Earning per share, EPS 48 Dividends per share, DPS 49 Book value per share, BVPS 50 $4.40 $1.00 $29.40 $5.24 $0.96 $26.00 51 Number Styles Cells K M N P Answers 1. What is the sales growth from 2019 to 2020? 2. Calculate the EBITDA profitability for: 3. Calculate the EBITDA coverage ratio for: 2019 2020 2019 2020 2019 2020 (show all formulas) 1 point 1.5 points 1.5 points 3 points 3 points 2 points 2 points 3 points 3 points 4. Calculate the Debt/Capitalization for: (include both preferred and common) 5. Calculate the Debt to EBITDA leverage ratio: 2019 2020
Step by Step Solution
There are 3 Steps involved in it

Get step-by-step solutions from verified subject matter experts