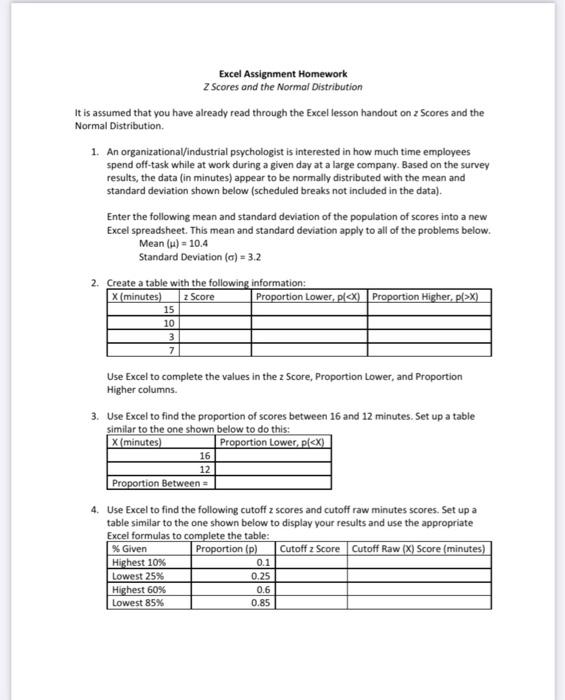
Question: Excel Assignment Homework Z Scores and the Normal Distribution It is assumed that you have already read through the Excel lesson handout on 2 Scores

Excel Assignment Homework Z Scores and the Normal
Excel Assignment Homework Z Scores and the Normal Distribution It is assumed that you have already read through the Excel lesson handout on 2 Scores and the Normal Distribution 1. An organizational/industrial psychologist is interested in how much time employees spend off-task while at work during a given day at a large company. Based on the survey results, the data (in minutes) appear to be normally distributed with the mean and standard deviation shown below (scheduled breaks not included in the data). Enter the following mean and standard deviation of the population of scores into a new Excel spreadsheet. This mean and standard deviation apply to all of the problems below. Mean () = 10.4 Standard Deviation (a) = 3.2 2. Create a table with the following information: X (minutes) Proportion Lower, plX) z Score 15 10 3 7 Use Excel to complete the values in the z Score, Proportion Lower, and Proportion Higher columns 3. Use Excel to find the proportion of scores between 16 and 12 minutes. Set up a table similar to the one shown below to do this: X(minutes) Proportion Lower, pl

Step by Step Solution

There are 3 Steps involved in it

1 Expert Approved Answer
Step: 1 Unlock blur-text-image
Question Has Been Solved by an Expert!

Get step-by-step solutions from verified subject matter experts

Step: 2 Unlock
Step: 3 Unlock

Students Have Also Explored These Related General Management Questions!