

Question: Excel capstone Due Friday by 1 1 : 5 9 pm Points 1 0 0 Submitting an external tool Available after Jul 2 6 at
Excel capstone
Due Friday by : pm
Points
Submitting an external tool
Available after Jul at am
The table below shows historical endofweek adjusted close prices including dividends for a stock and the S&P
tableABCDWeek,Stock,S&P Sum, SUMC:C
Copy and paste all data into your own spreadineet. Calculate the sum of the prices for both assets to check that you copied all values correctly. If your sums match those shown above, you should delete row in your spreadsheet.
Attempt
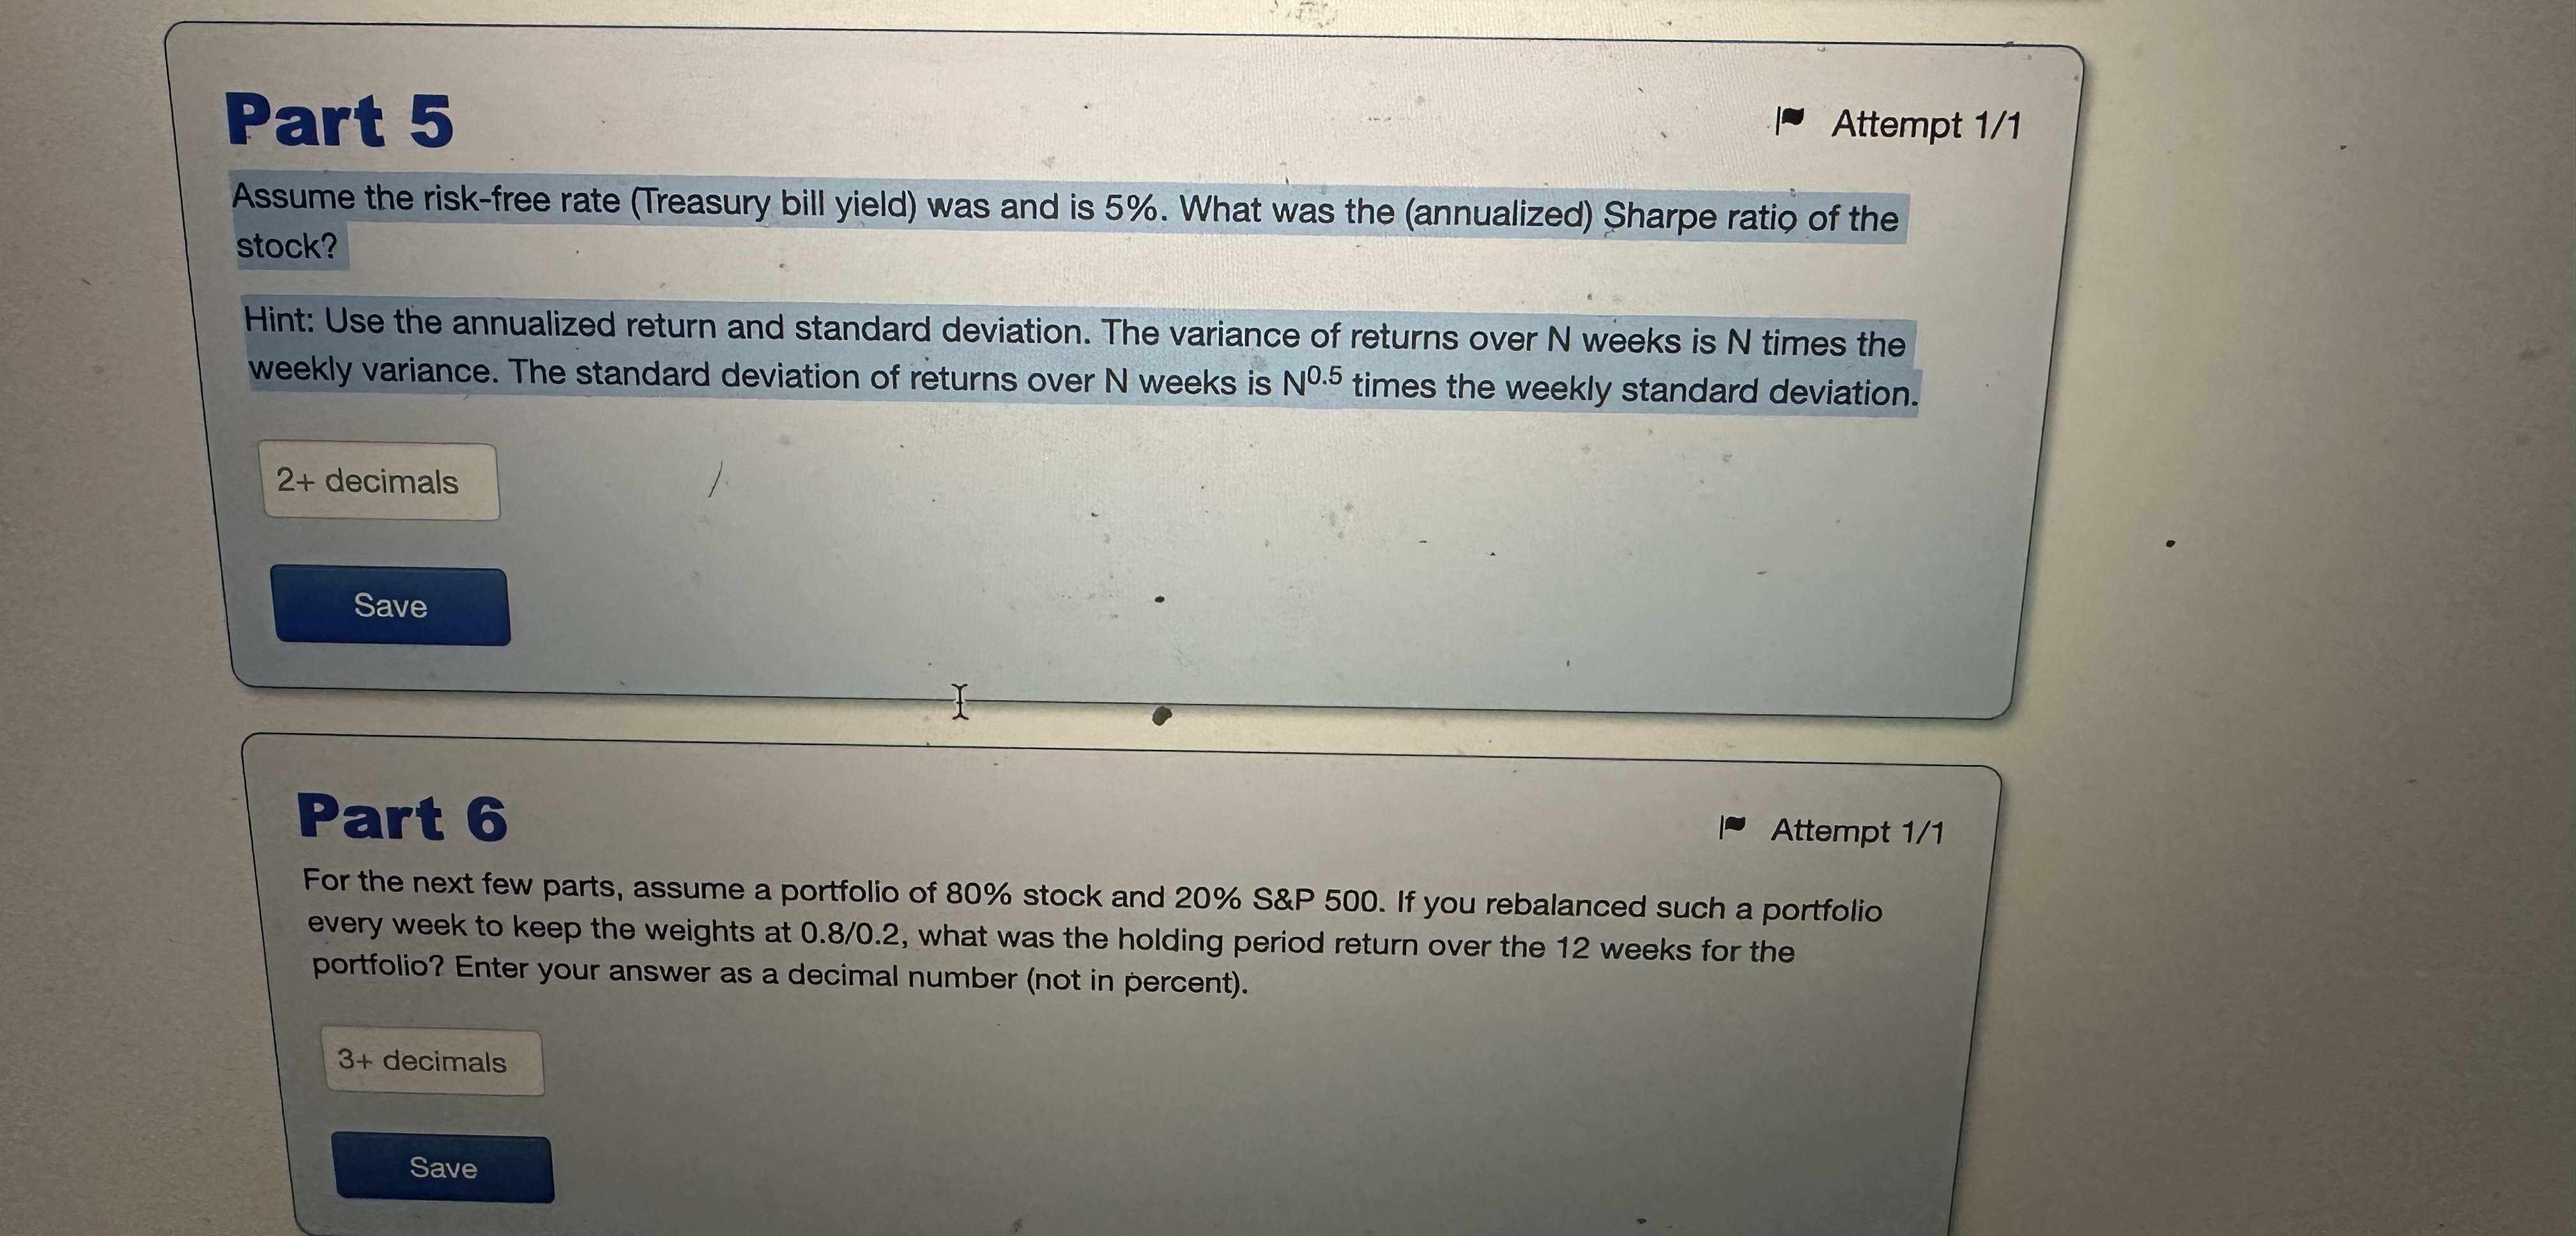
Assume the riskfree rate Treasury bill yield was and is What was the annualized Sharpe ratio of the stock?
Hint: Use the annualized return and standard deviation. The variance of returns over N weeks is N times the weekly variance. The standard deviation of returns over N weeks is times the weekly standard deviation.
decimals
Attempt
For the next few parts, assume a portfolio of stock and S&P If you rebalanced such a portfolio every week to keep the weights at what was the holding period return over the weeks for the portfolio? Enter your answer as a decimal number not in percent
Step by Step Solution
There are 3 Steps involved in it
1 Expert Approved Answer
Step: 1 Unlock

Question Has Been Solved by an Expert!
Get step-by-step solutions from verified subject matter experts
Step: 2 Unlock
Step: 3 Unlock