

Question: Excel File attached in link https: //easyupload.io/pl7alf The corsxlsx data set provided shows various features of 32 different models of cars. Bv first reading the
Excel File attached in link
https://easyupload.io/pl7alf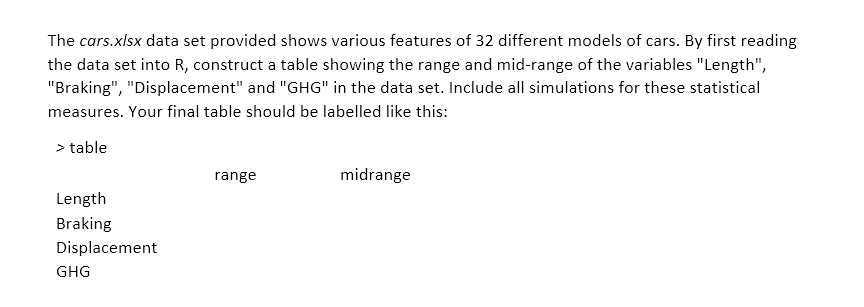
The corsxlsx data set provided shows various features of 32 different models of cars. Bv first reading the data set into R, construct a table showing the range and midrange of the variables \"Length", \"Braking , Displacement" and \"GHG\" in the data set. Include all simulations for these statistical measures. Your final table should be labelled like this: .1? table range midrange Length Braking Displacement lSHE
Step by Step Solution
There are 3 Steps involved in it
1 Expert Approved Answer
Step: 1 Unlock

Question Has Been Solved by an Expert!
Get step-by-step solutions from verified subject matter experts
Step: 2 Unlock
Step: 3 Unlock