Question: Excel File Edit View Insert Format L2000 C) GGG PP PP PP O e S S S R N A e AN ISR IS =k
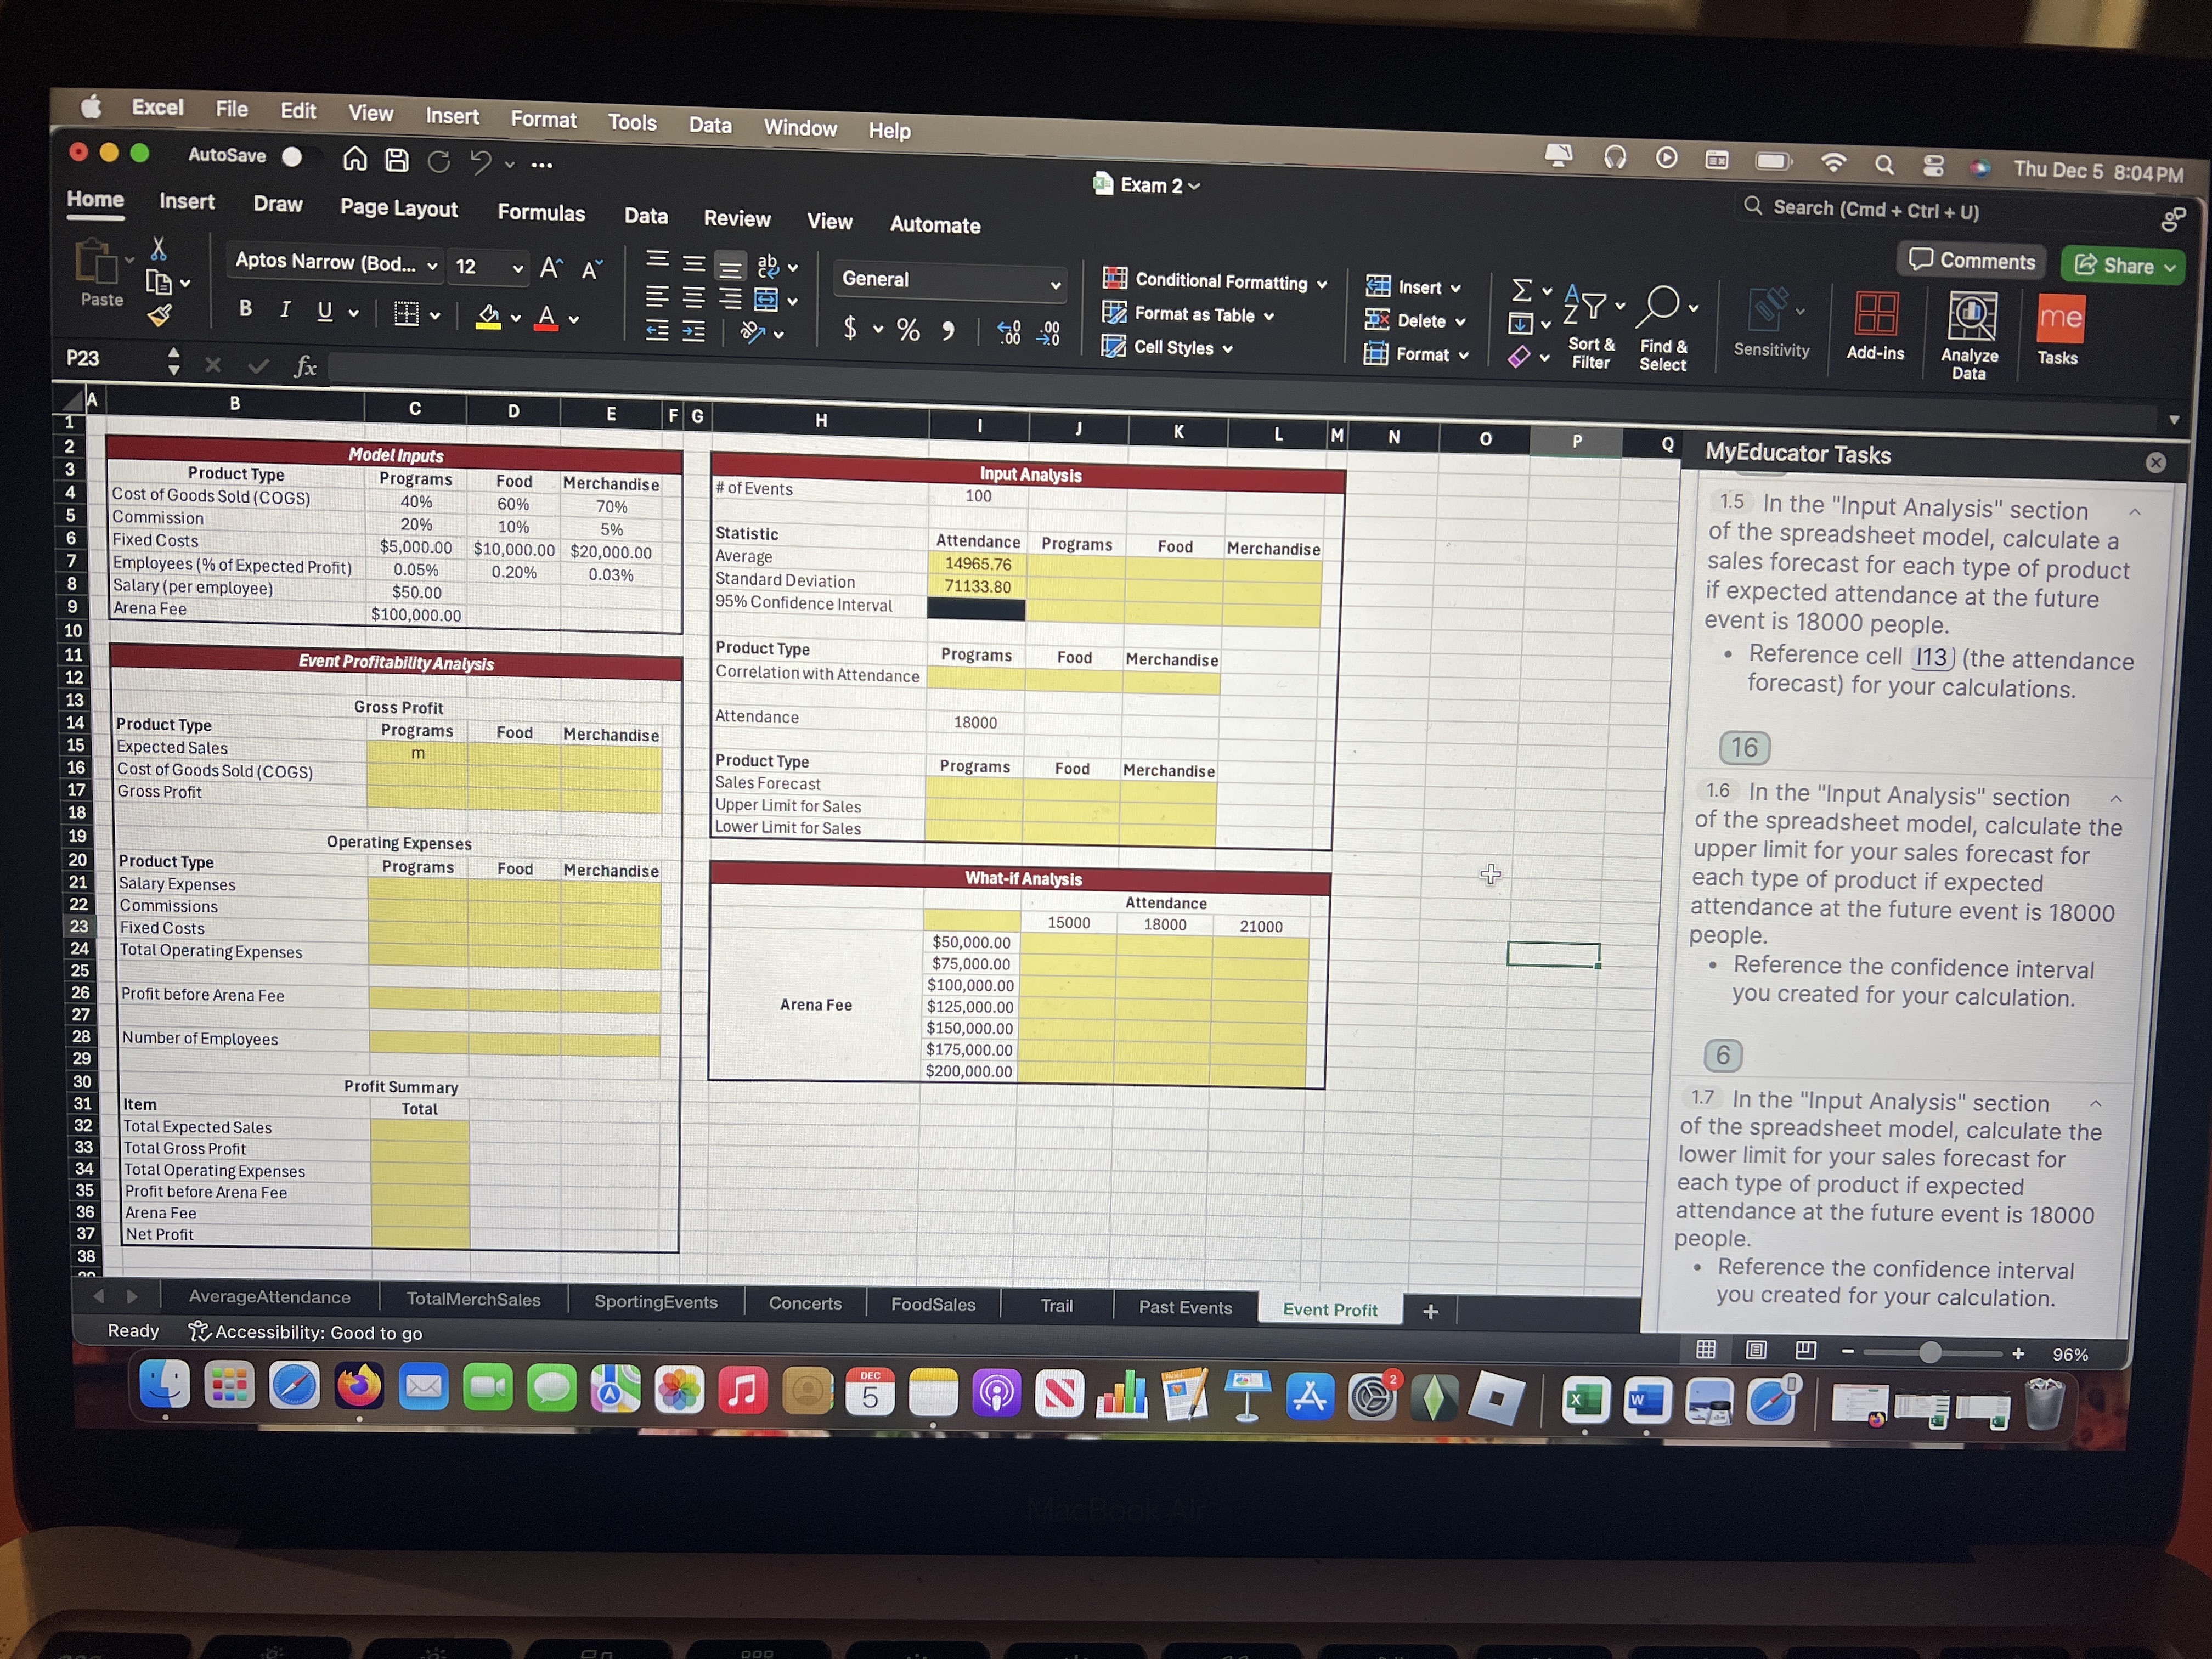
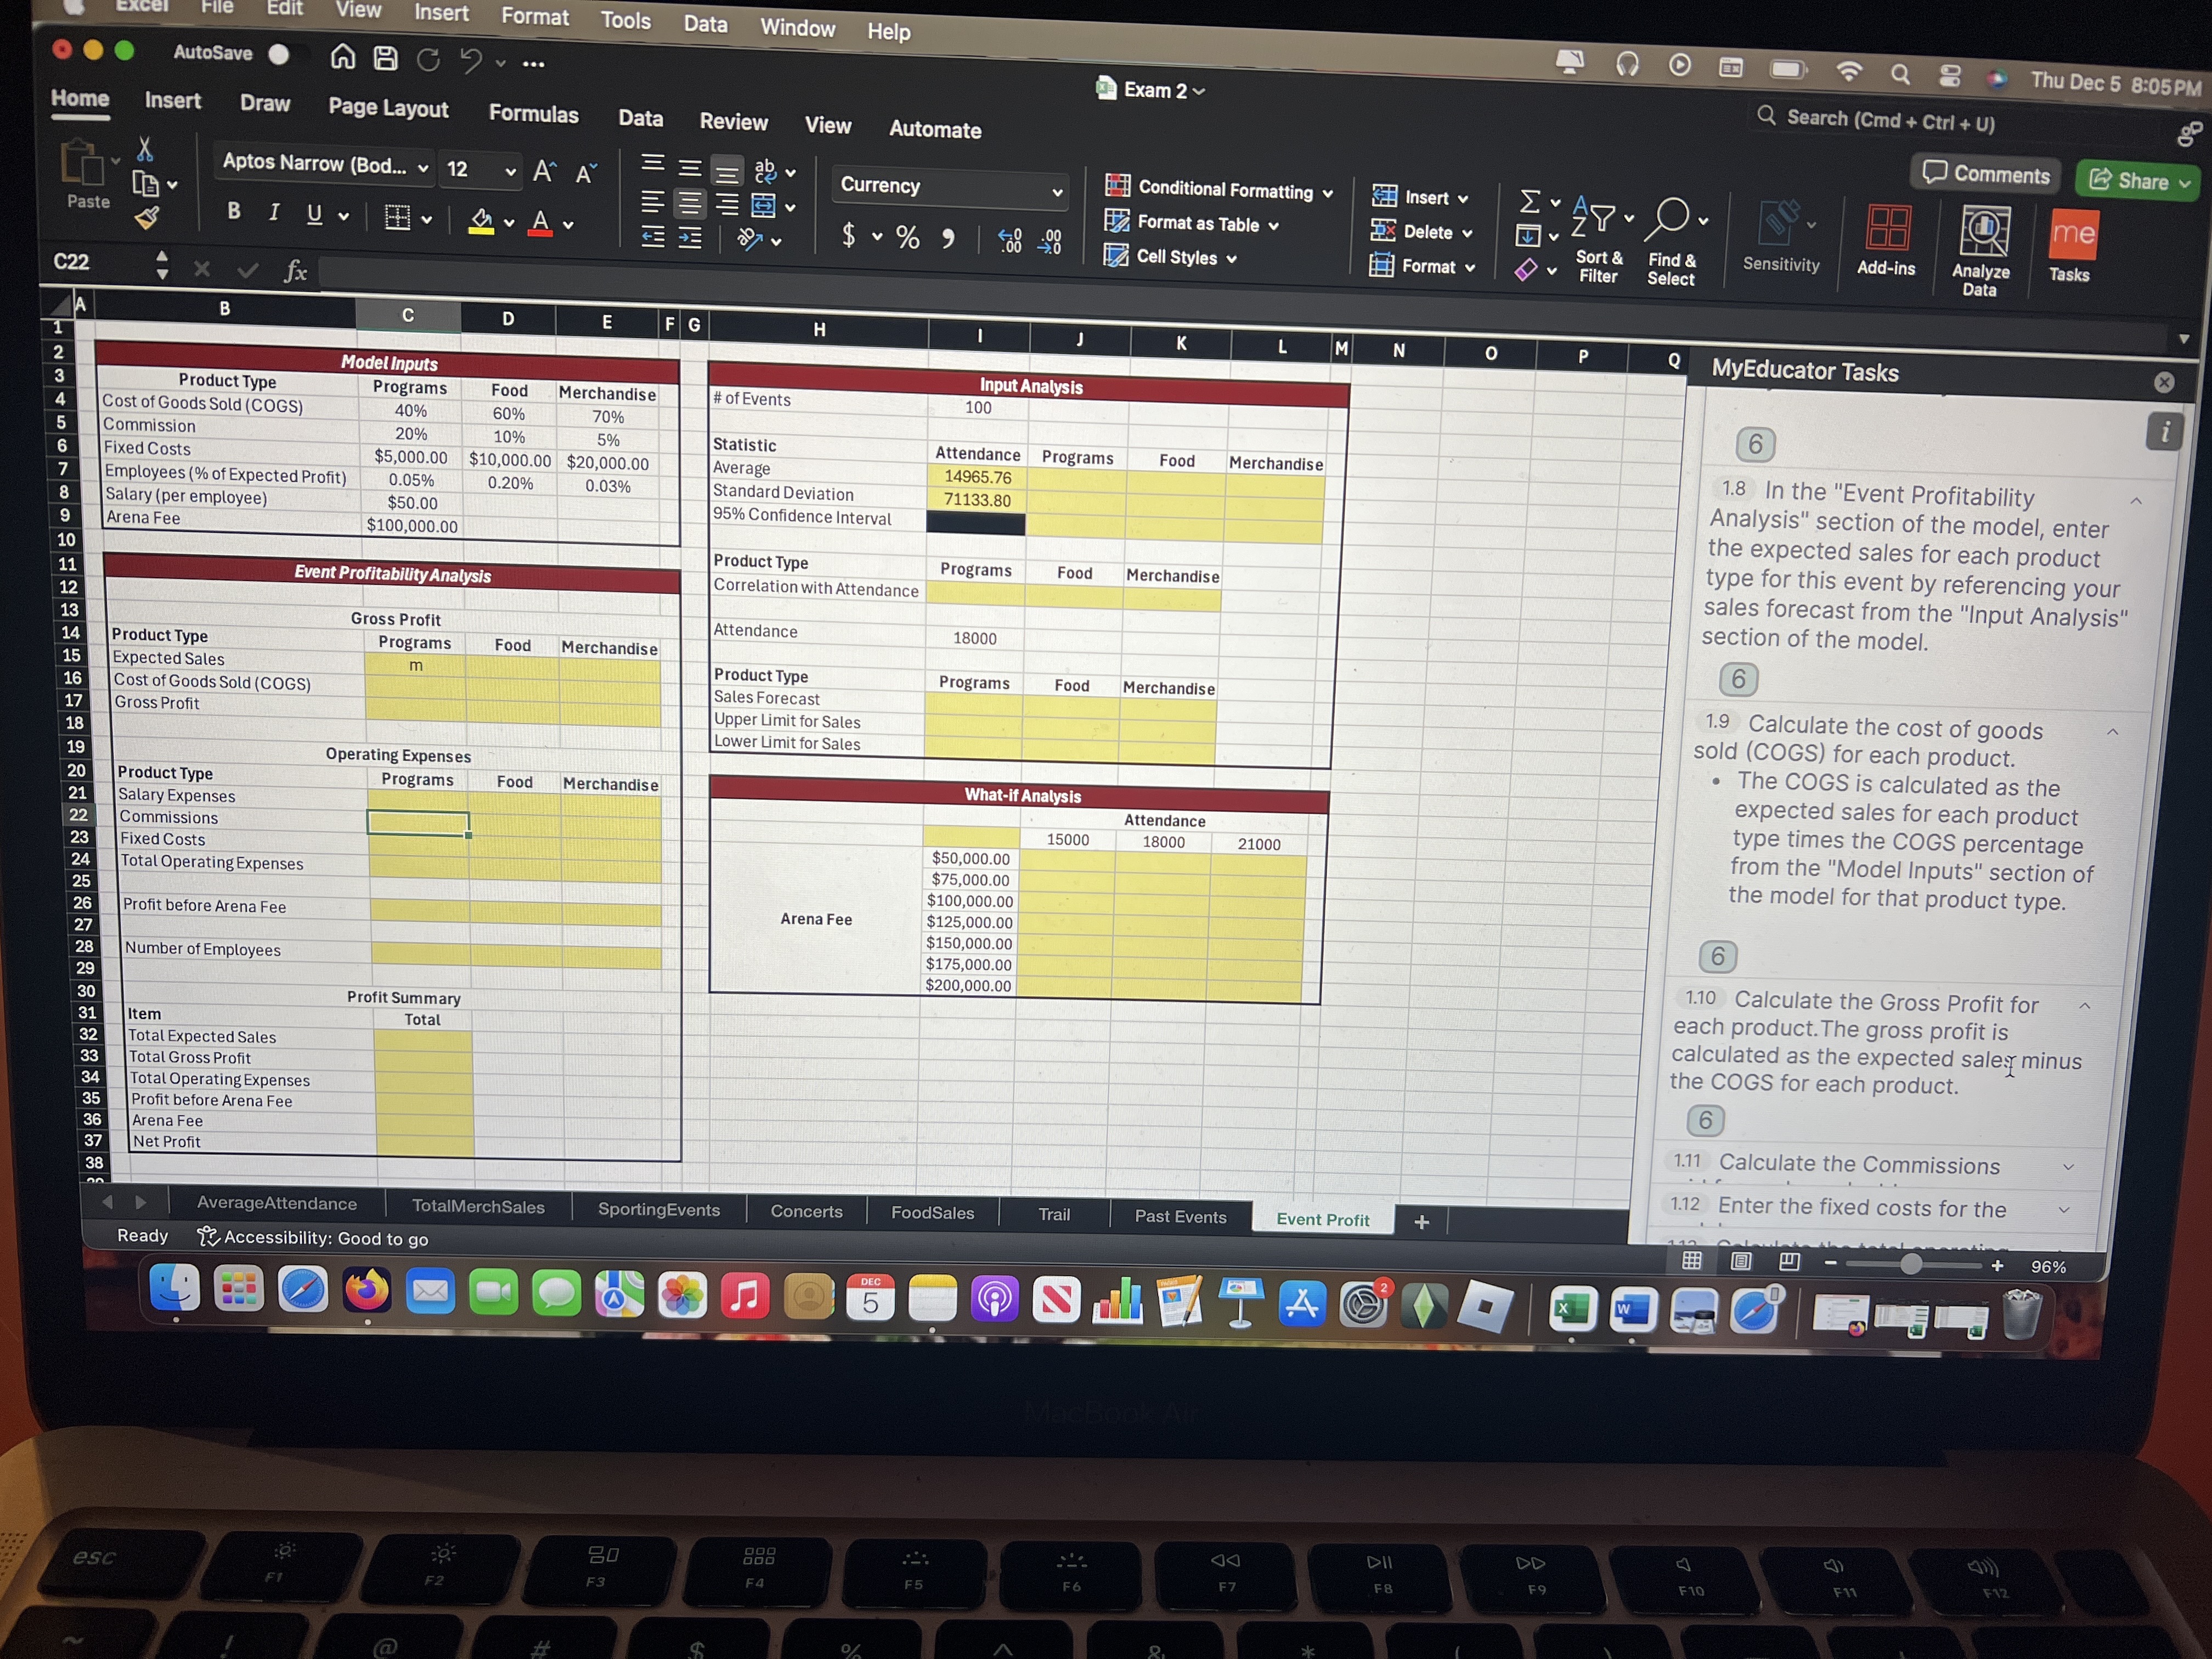
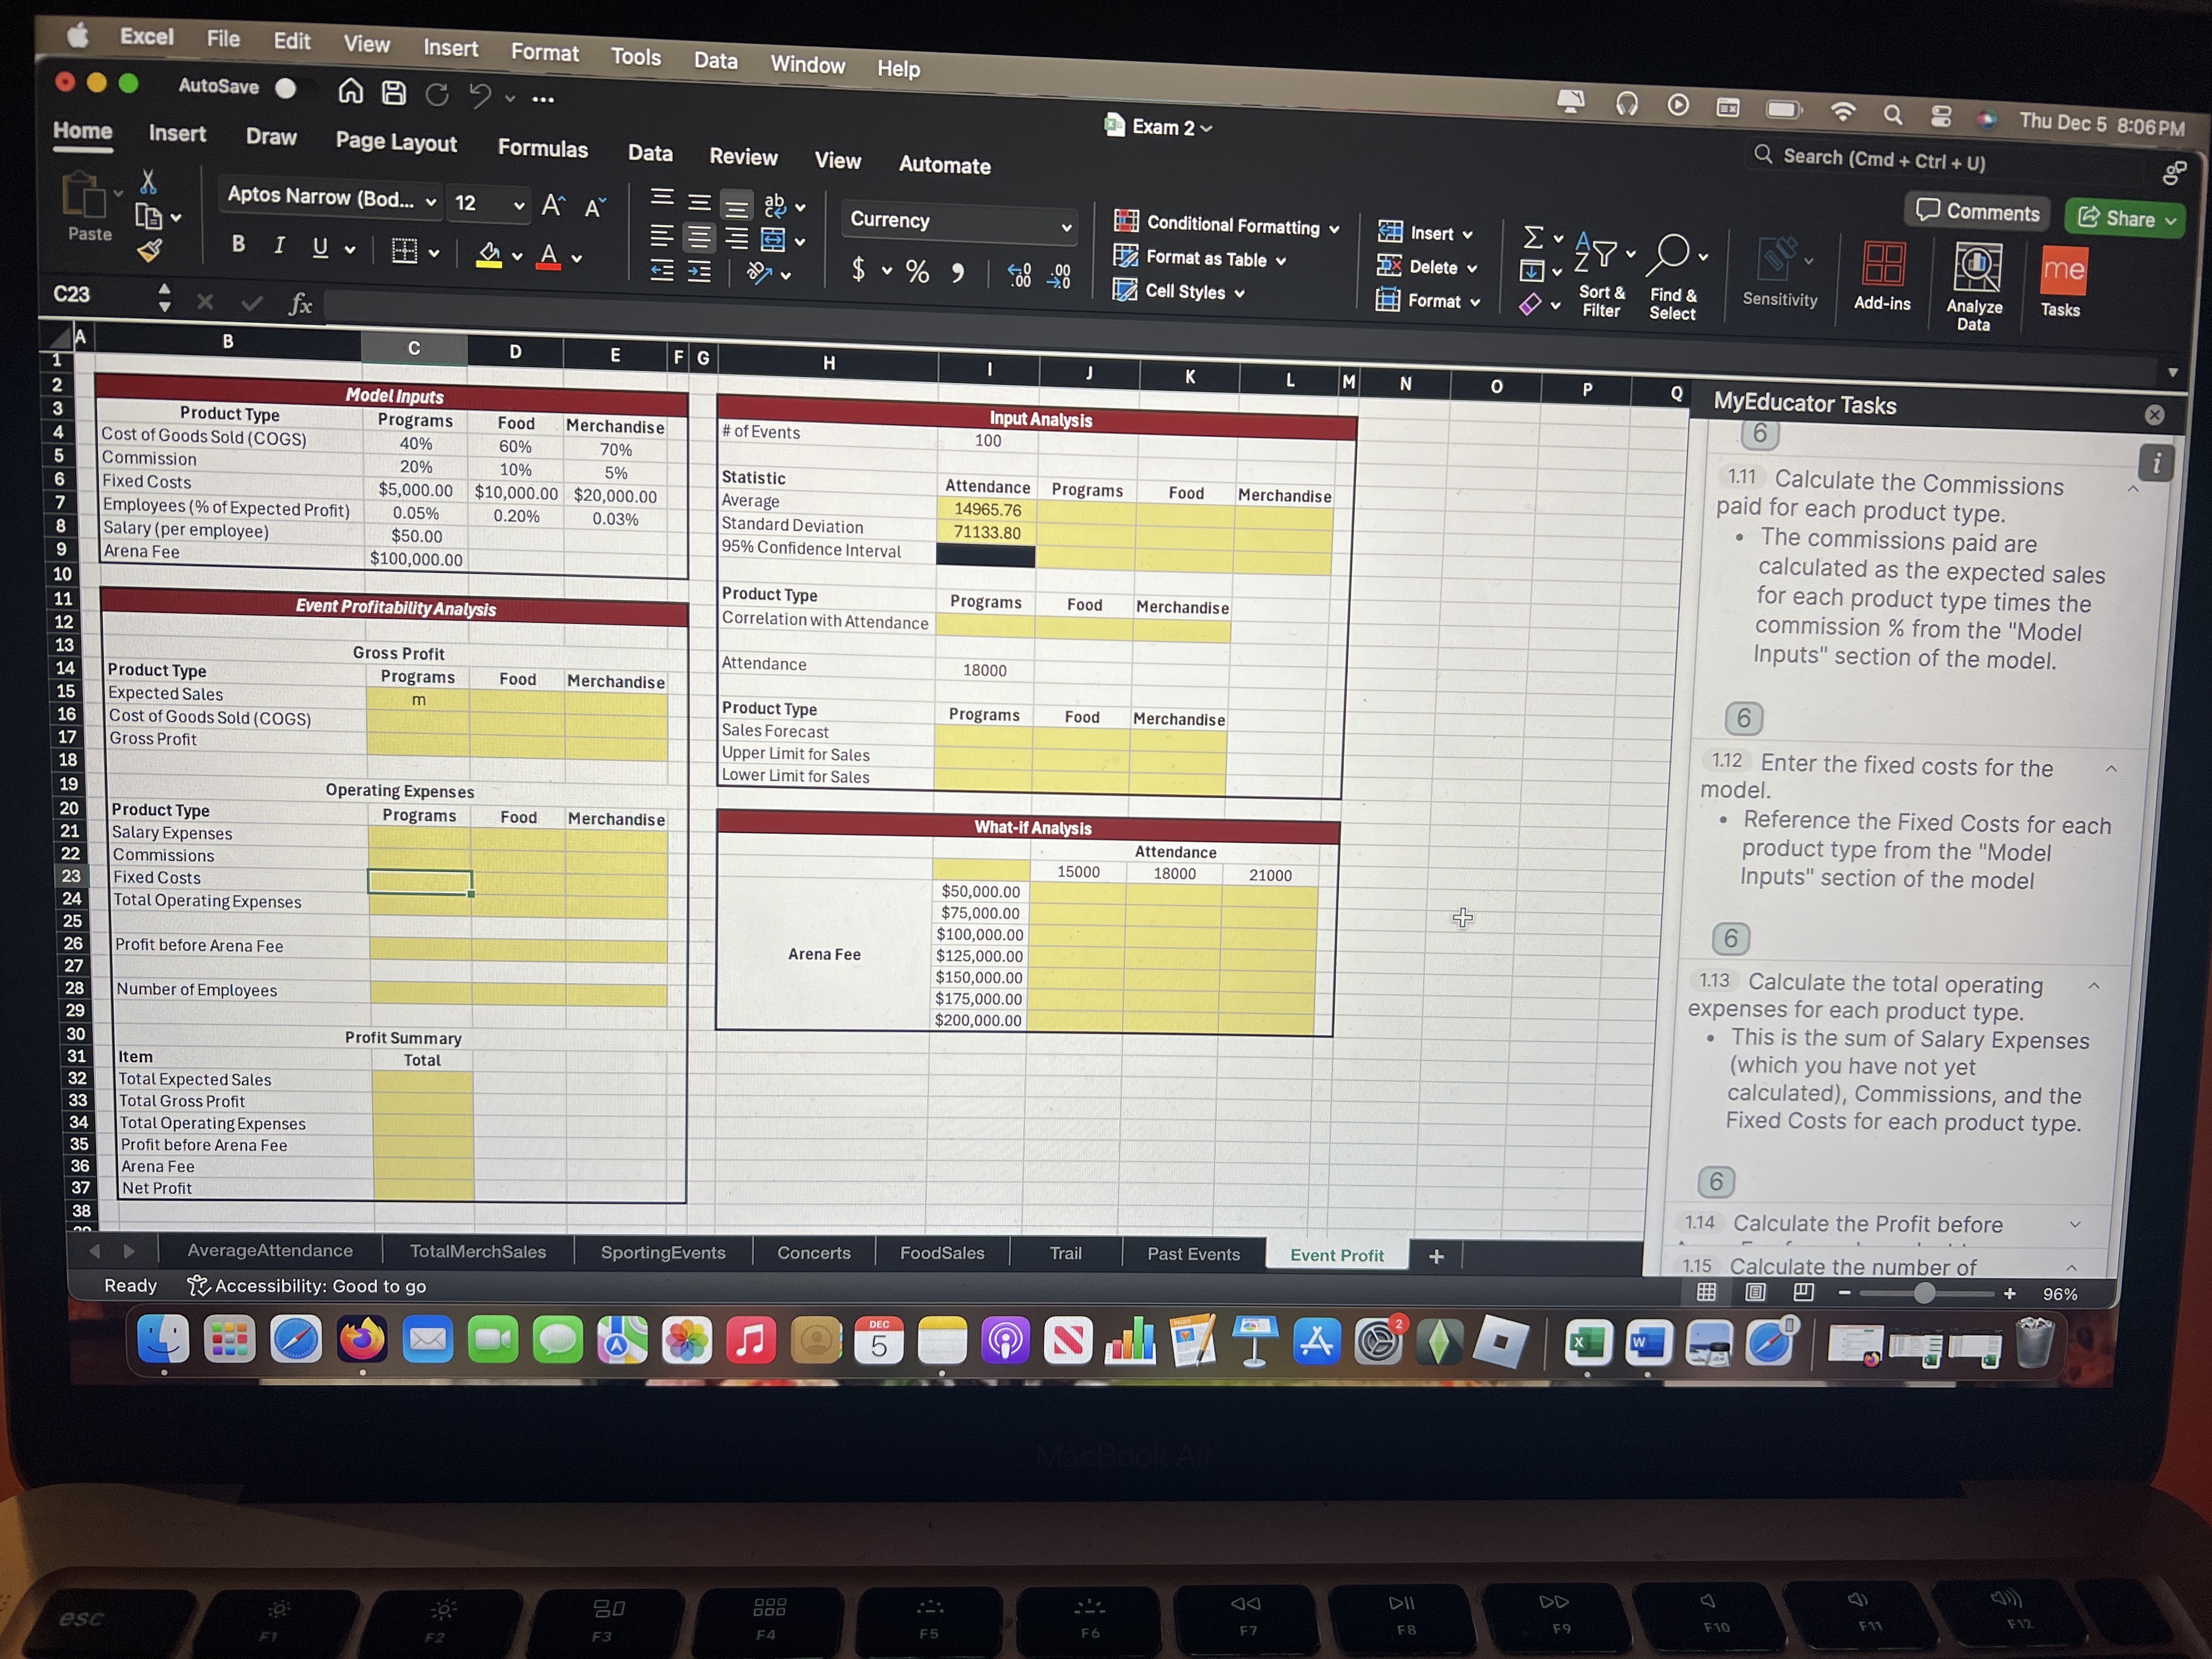
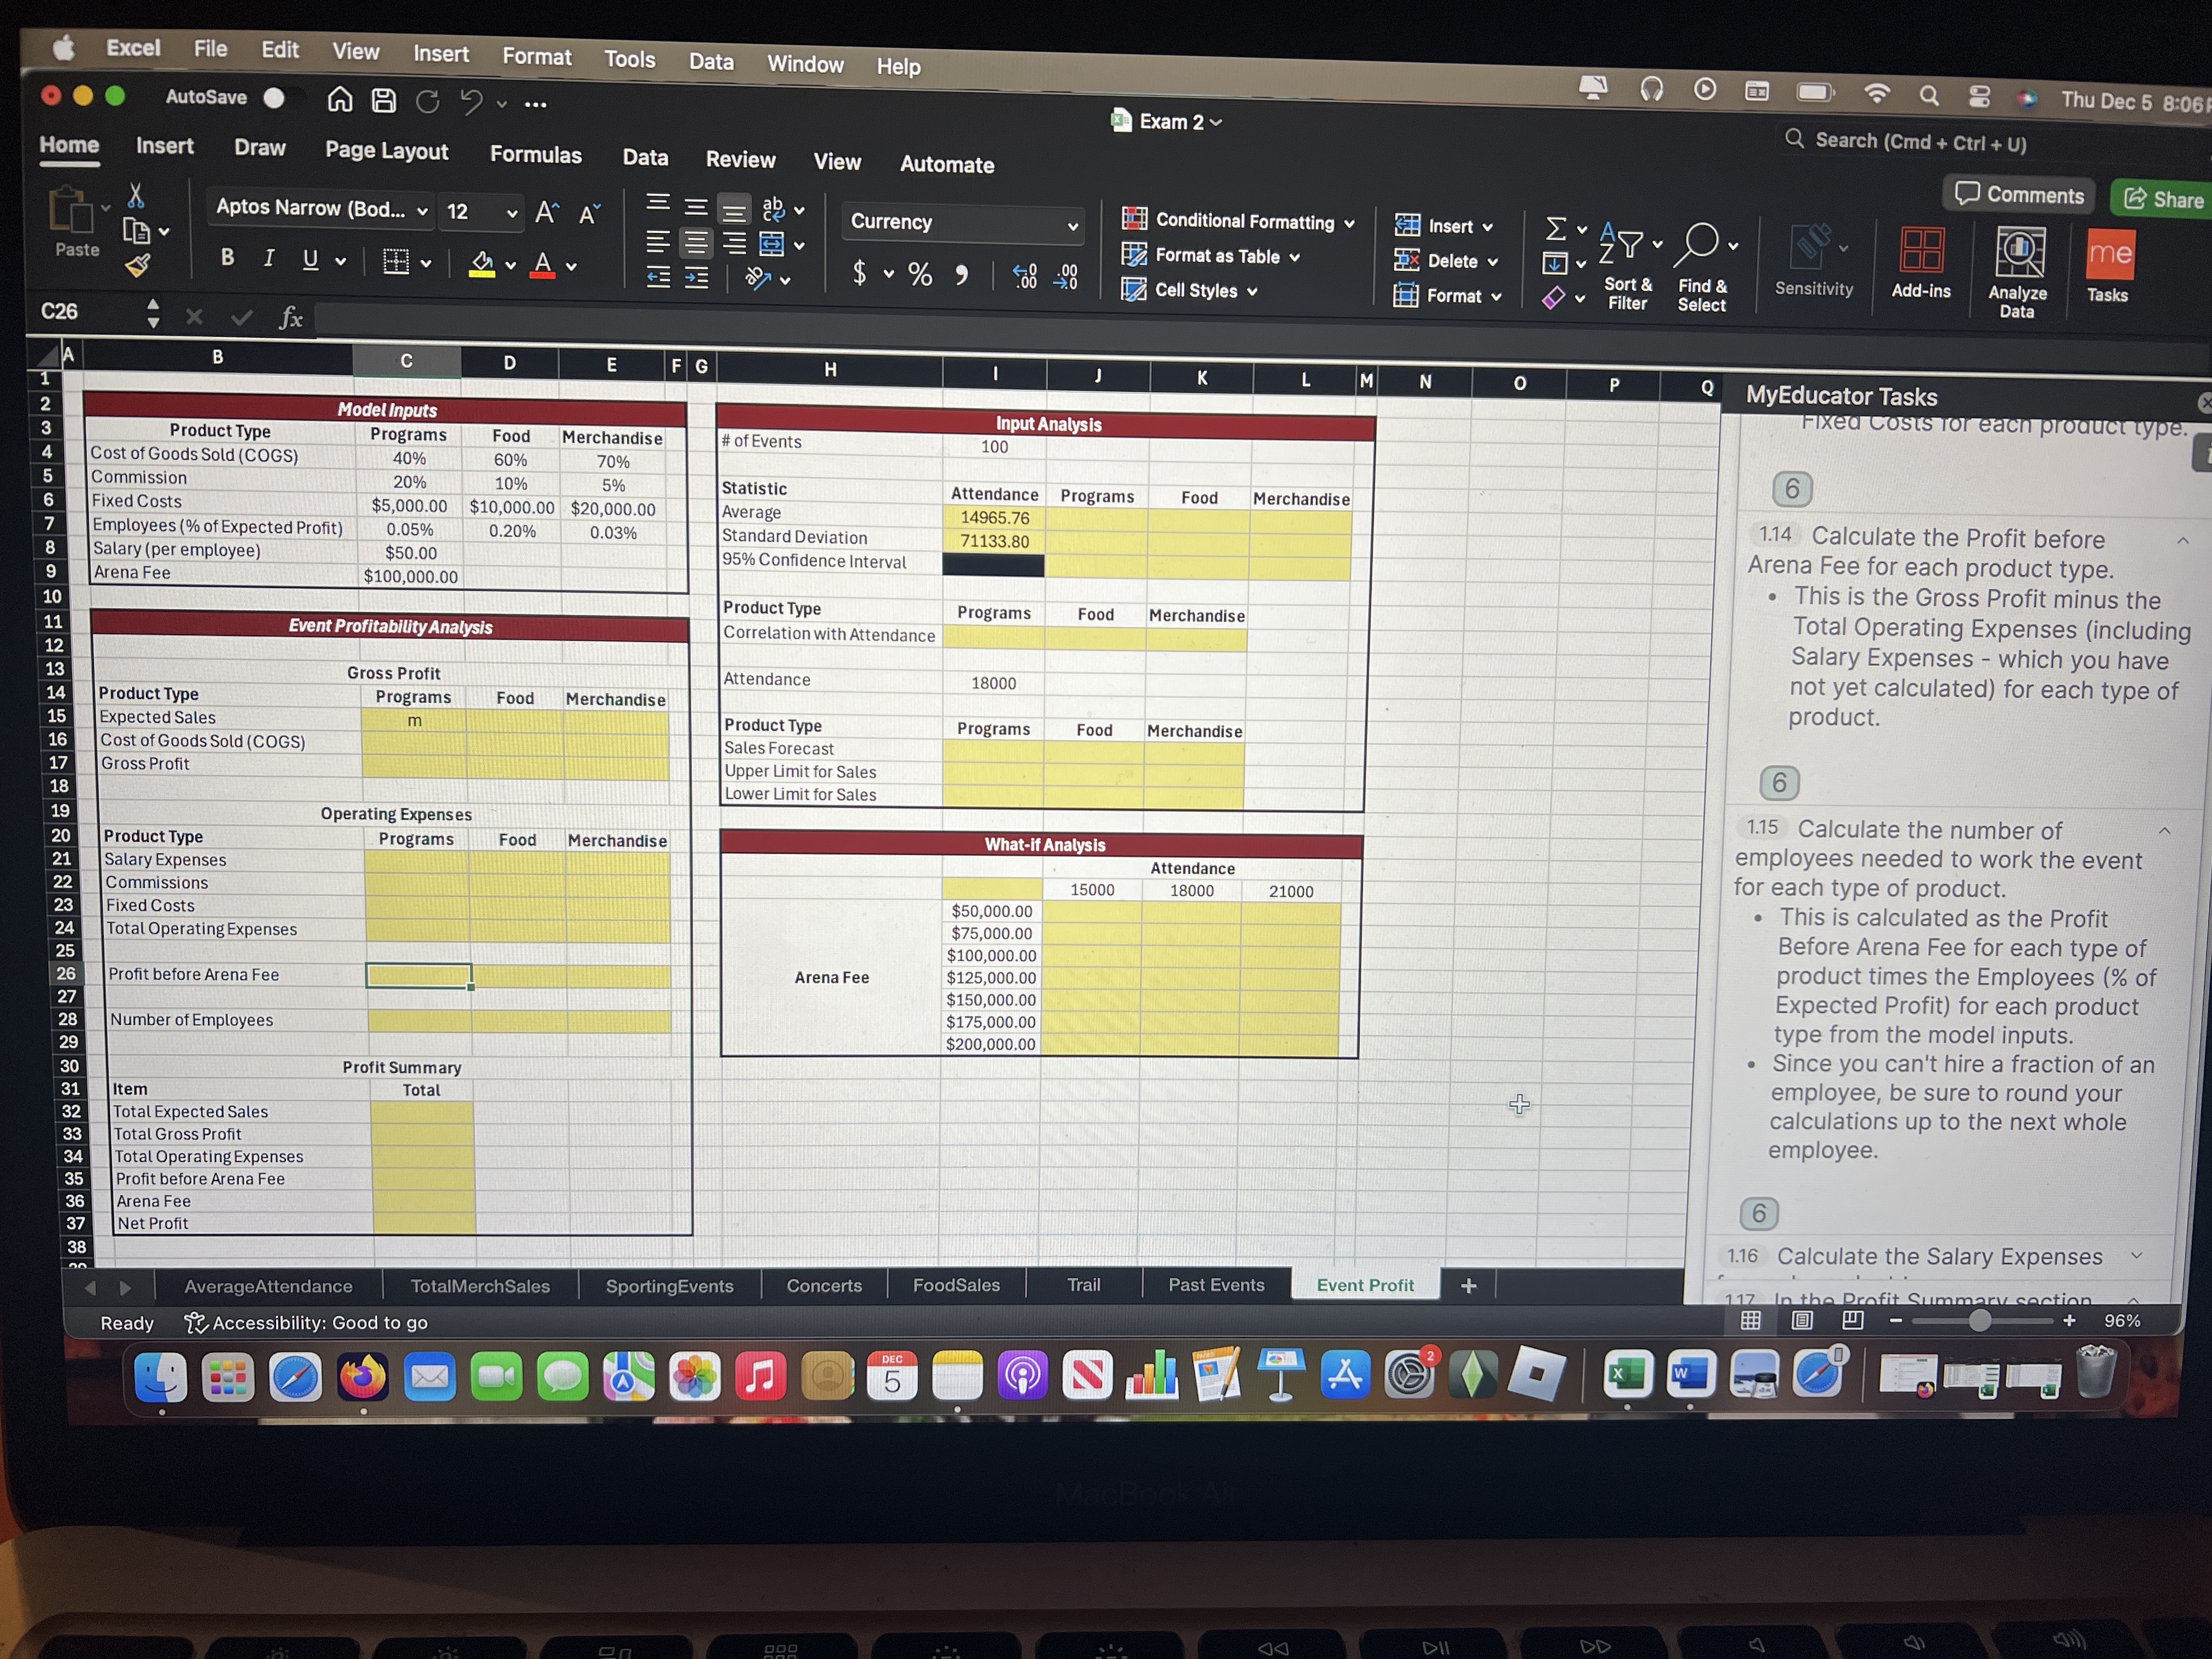
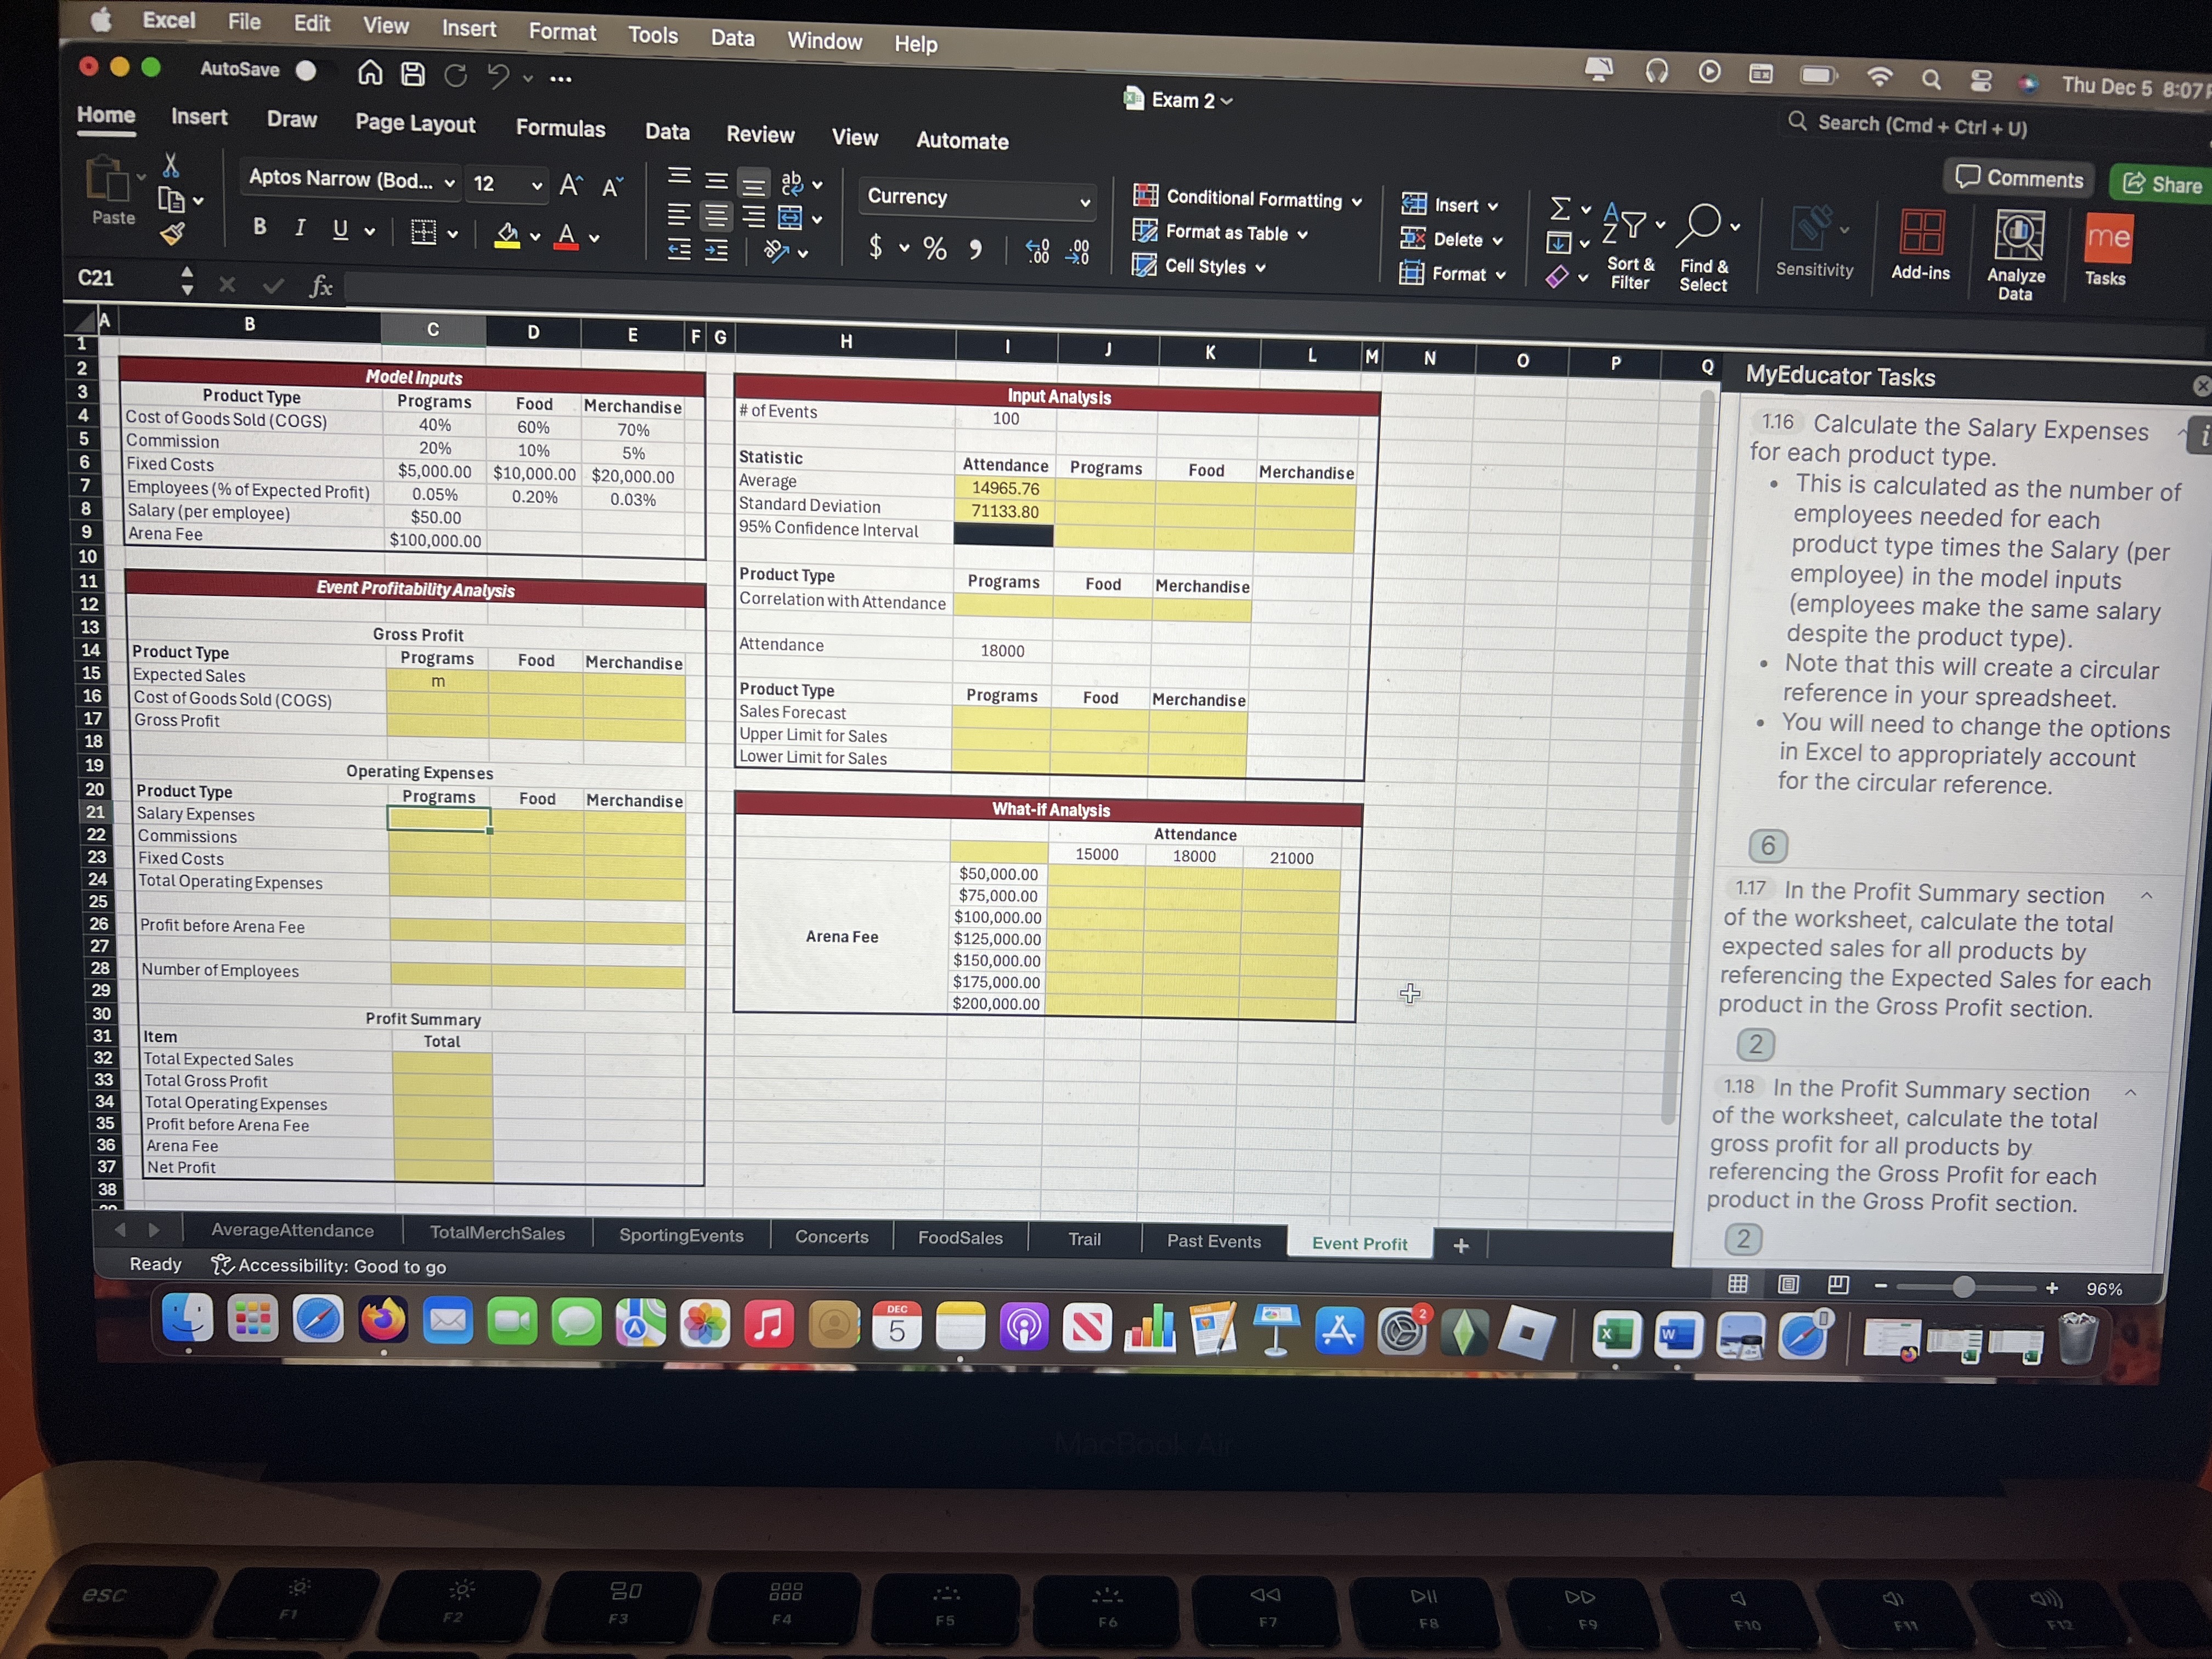
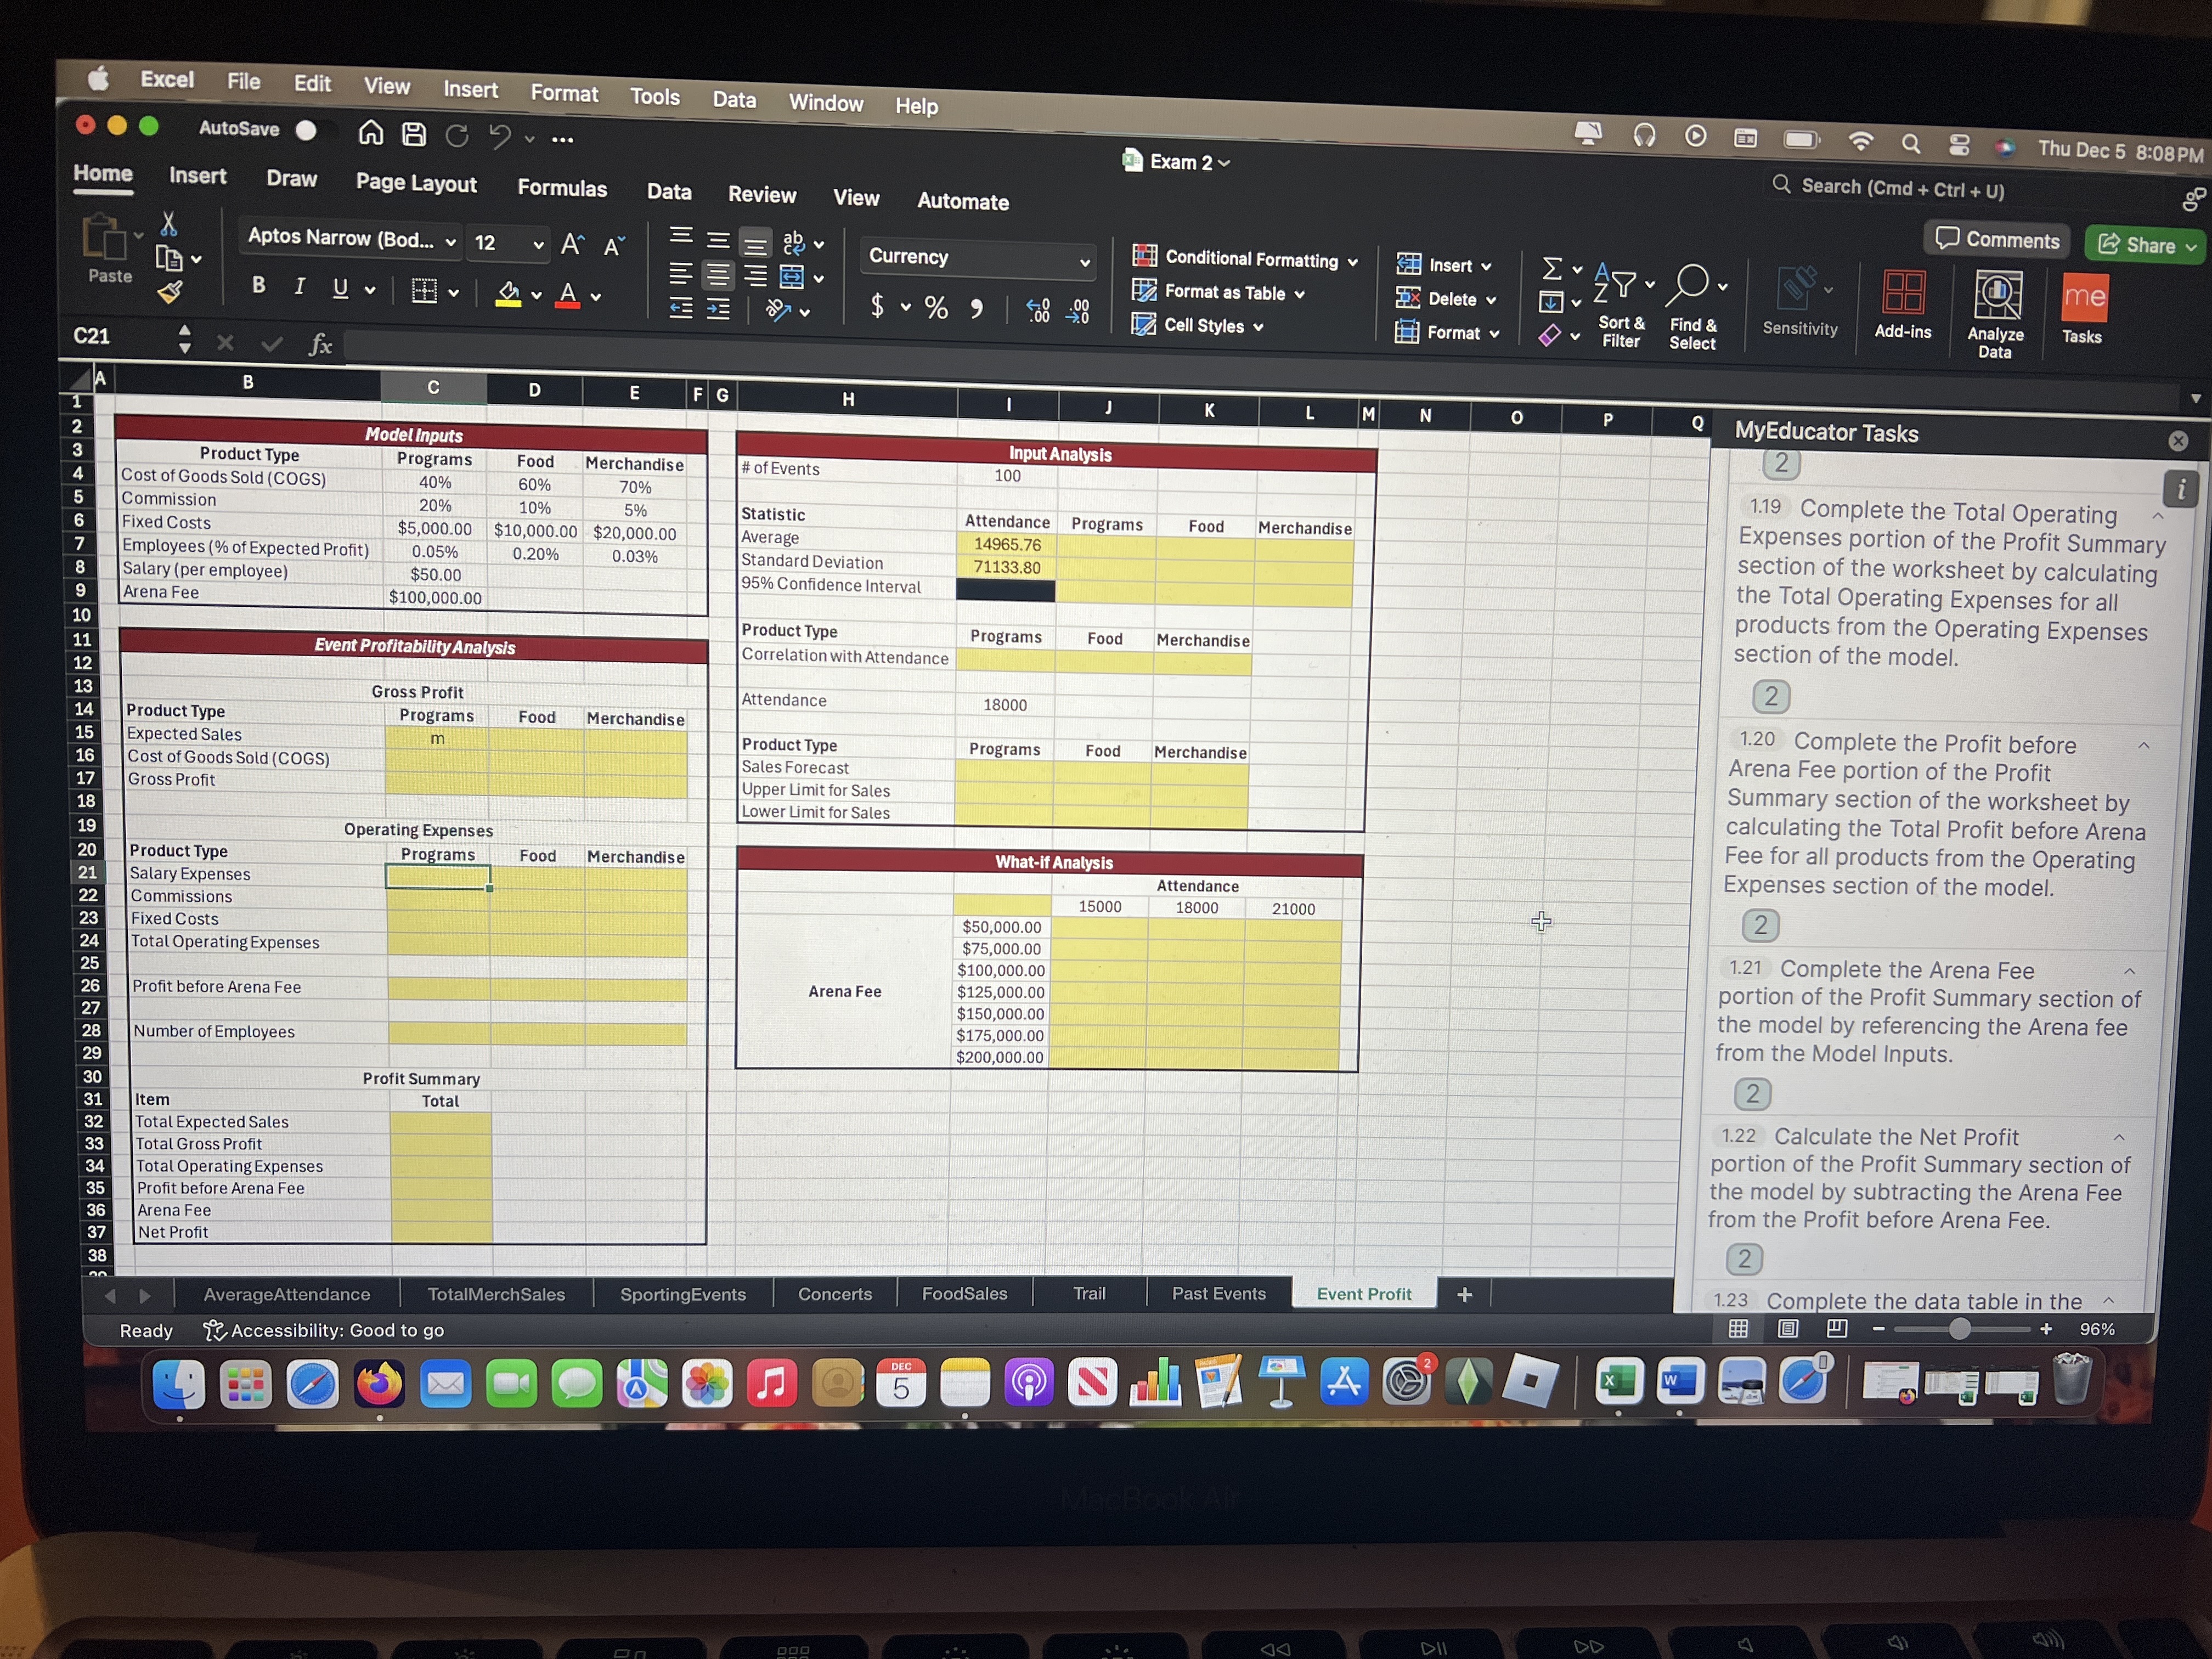
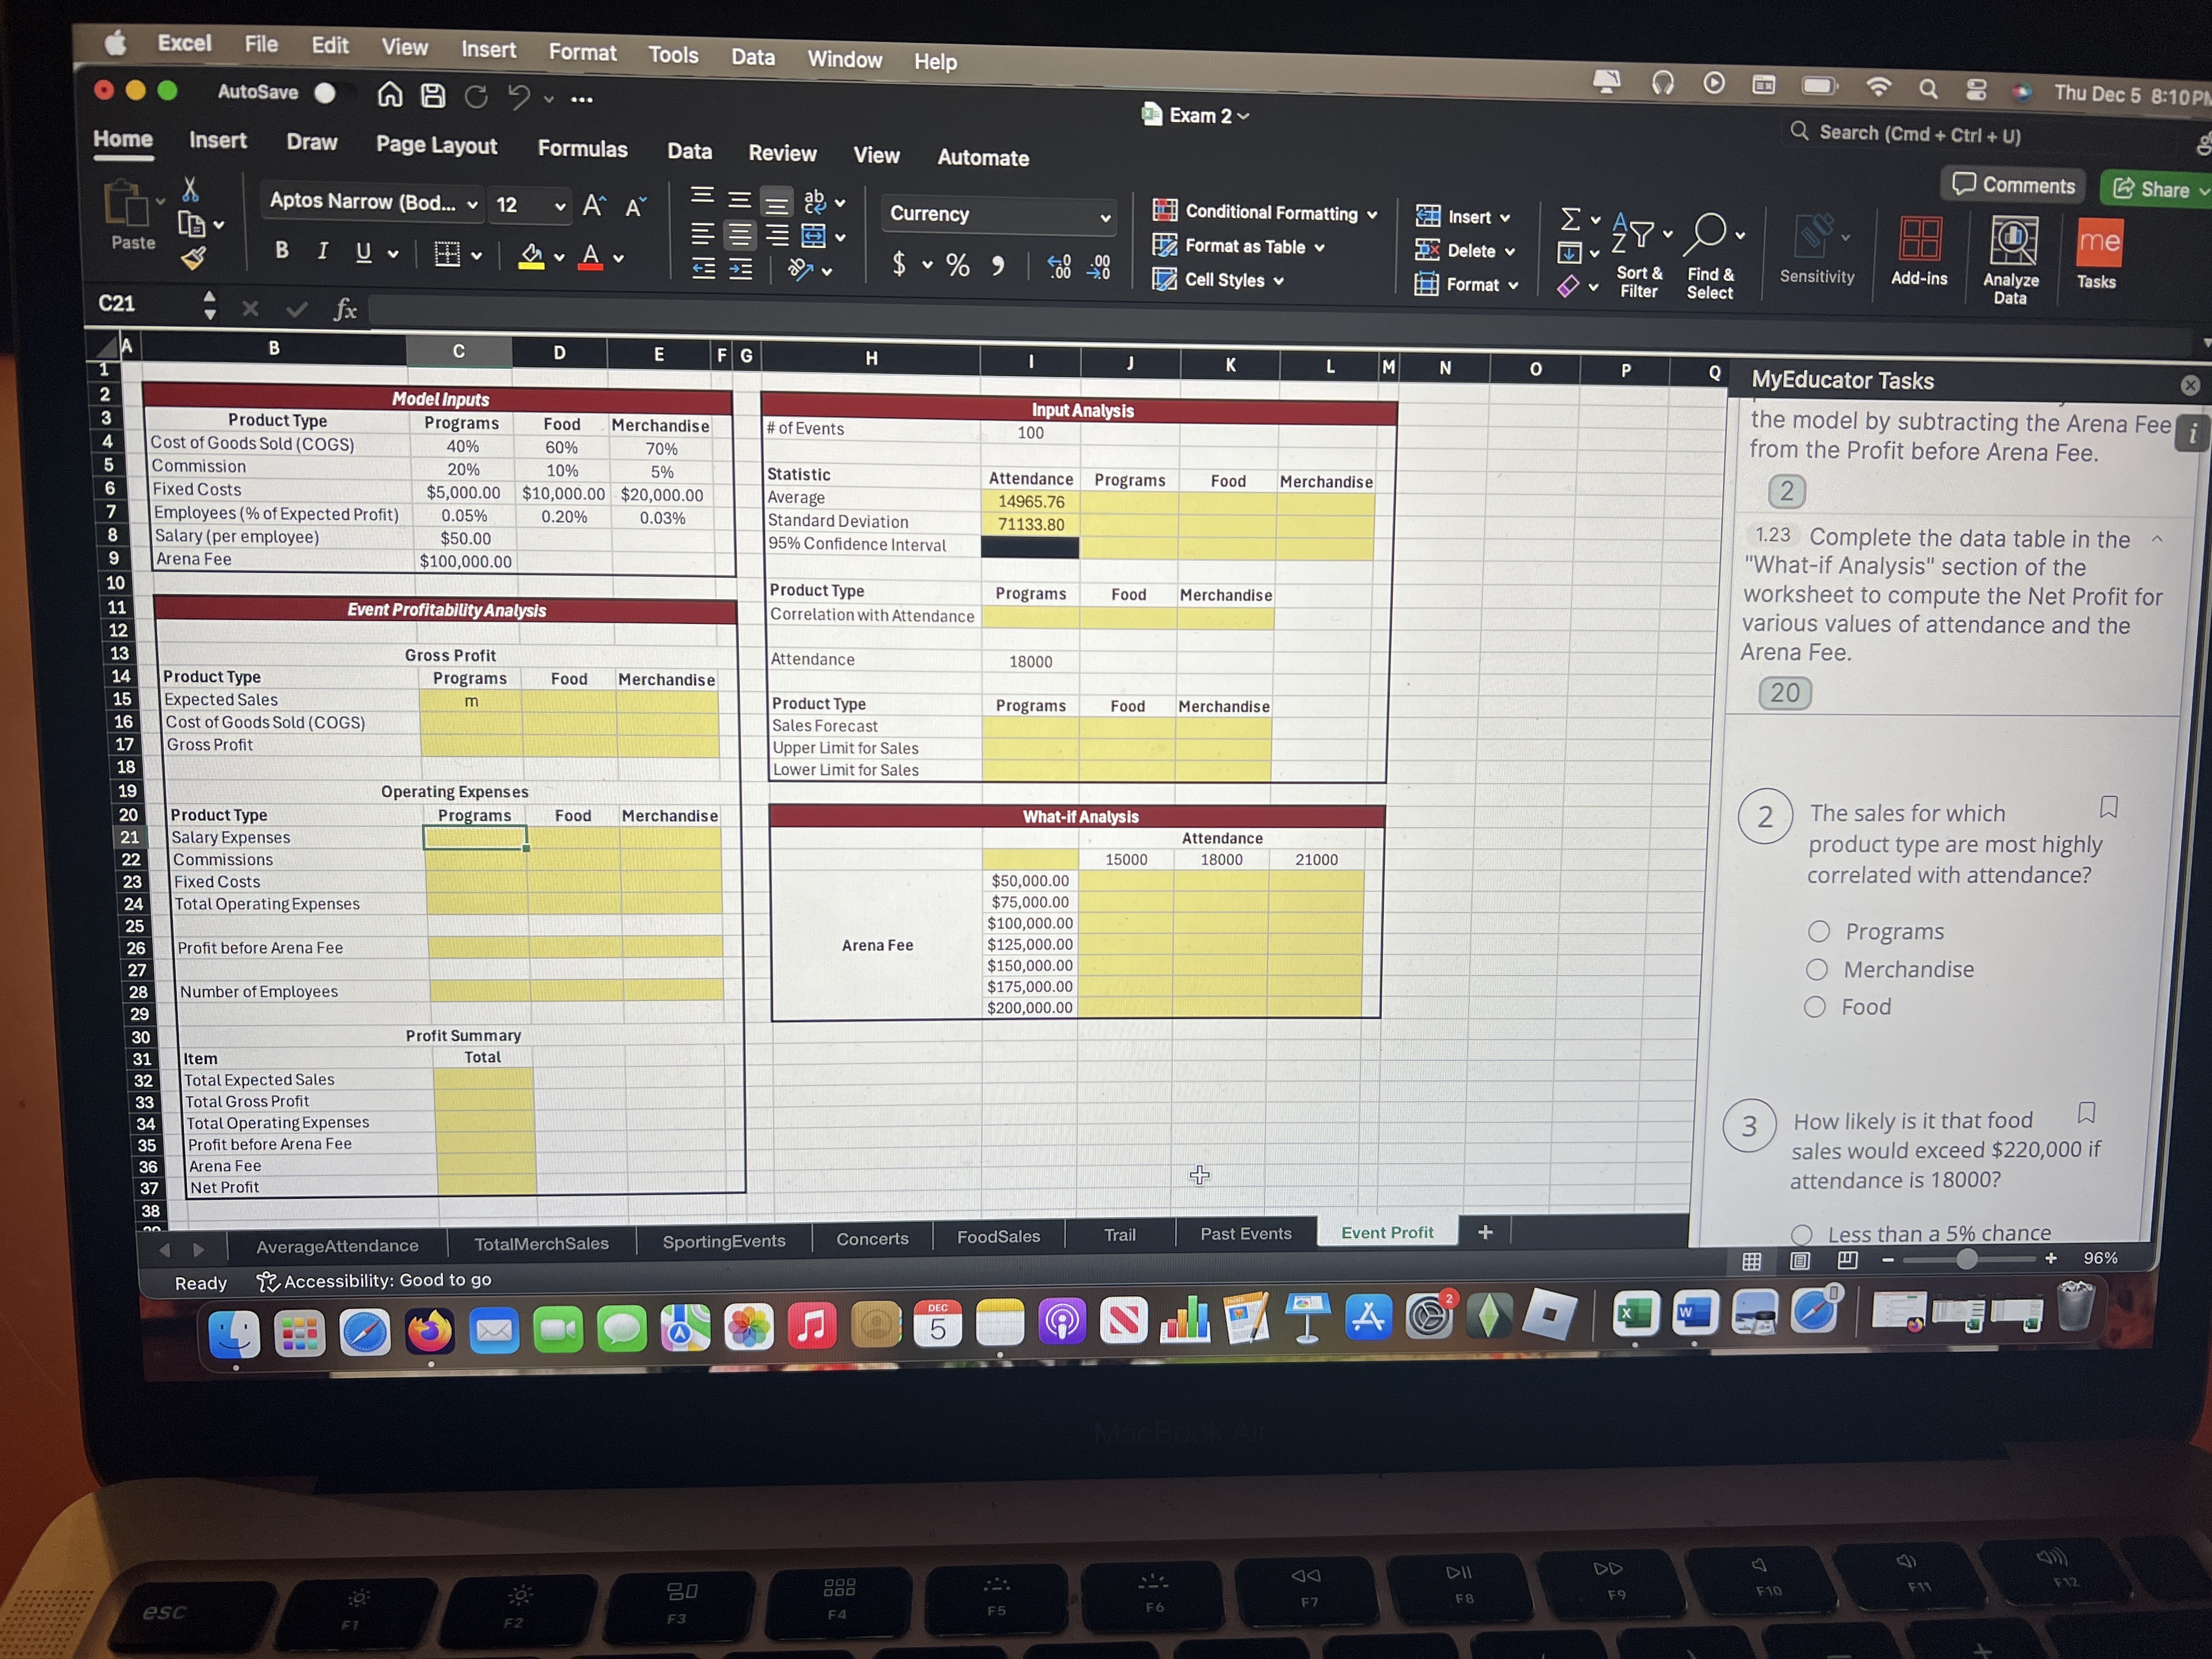
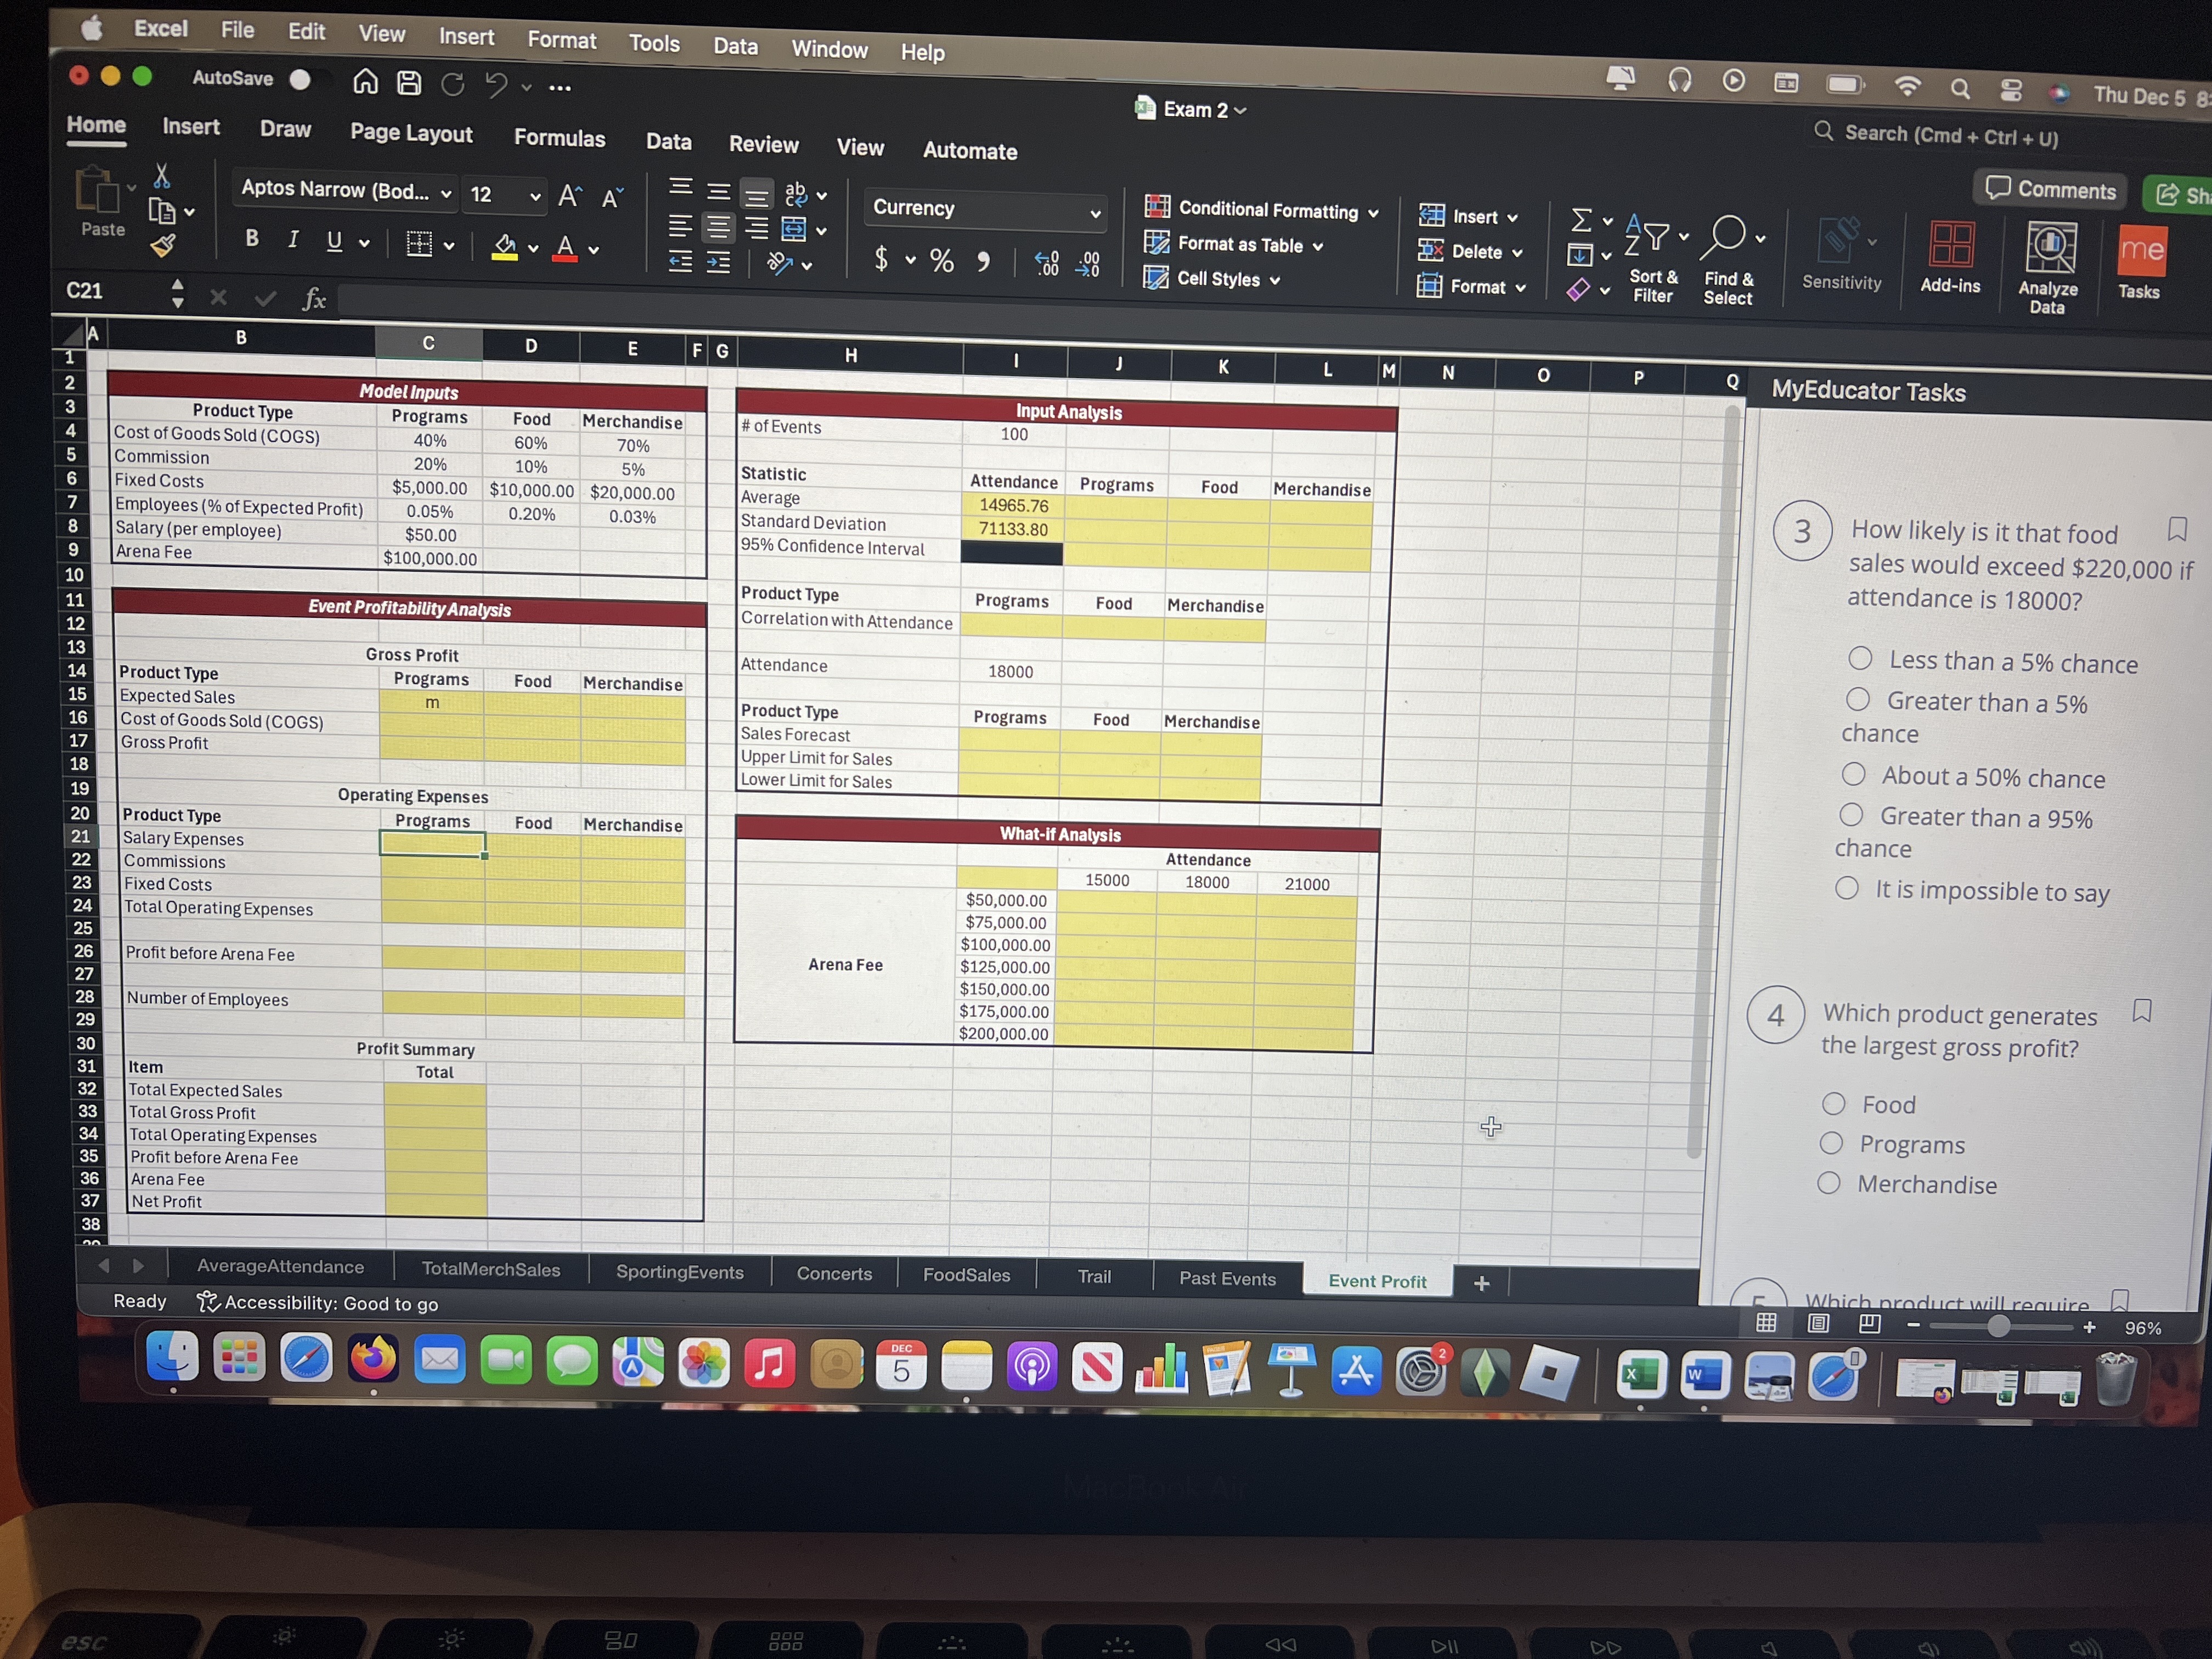
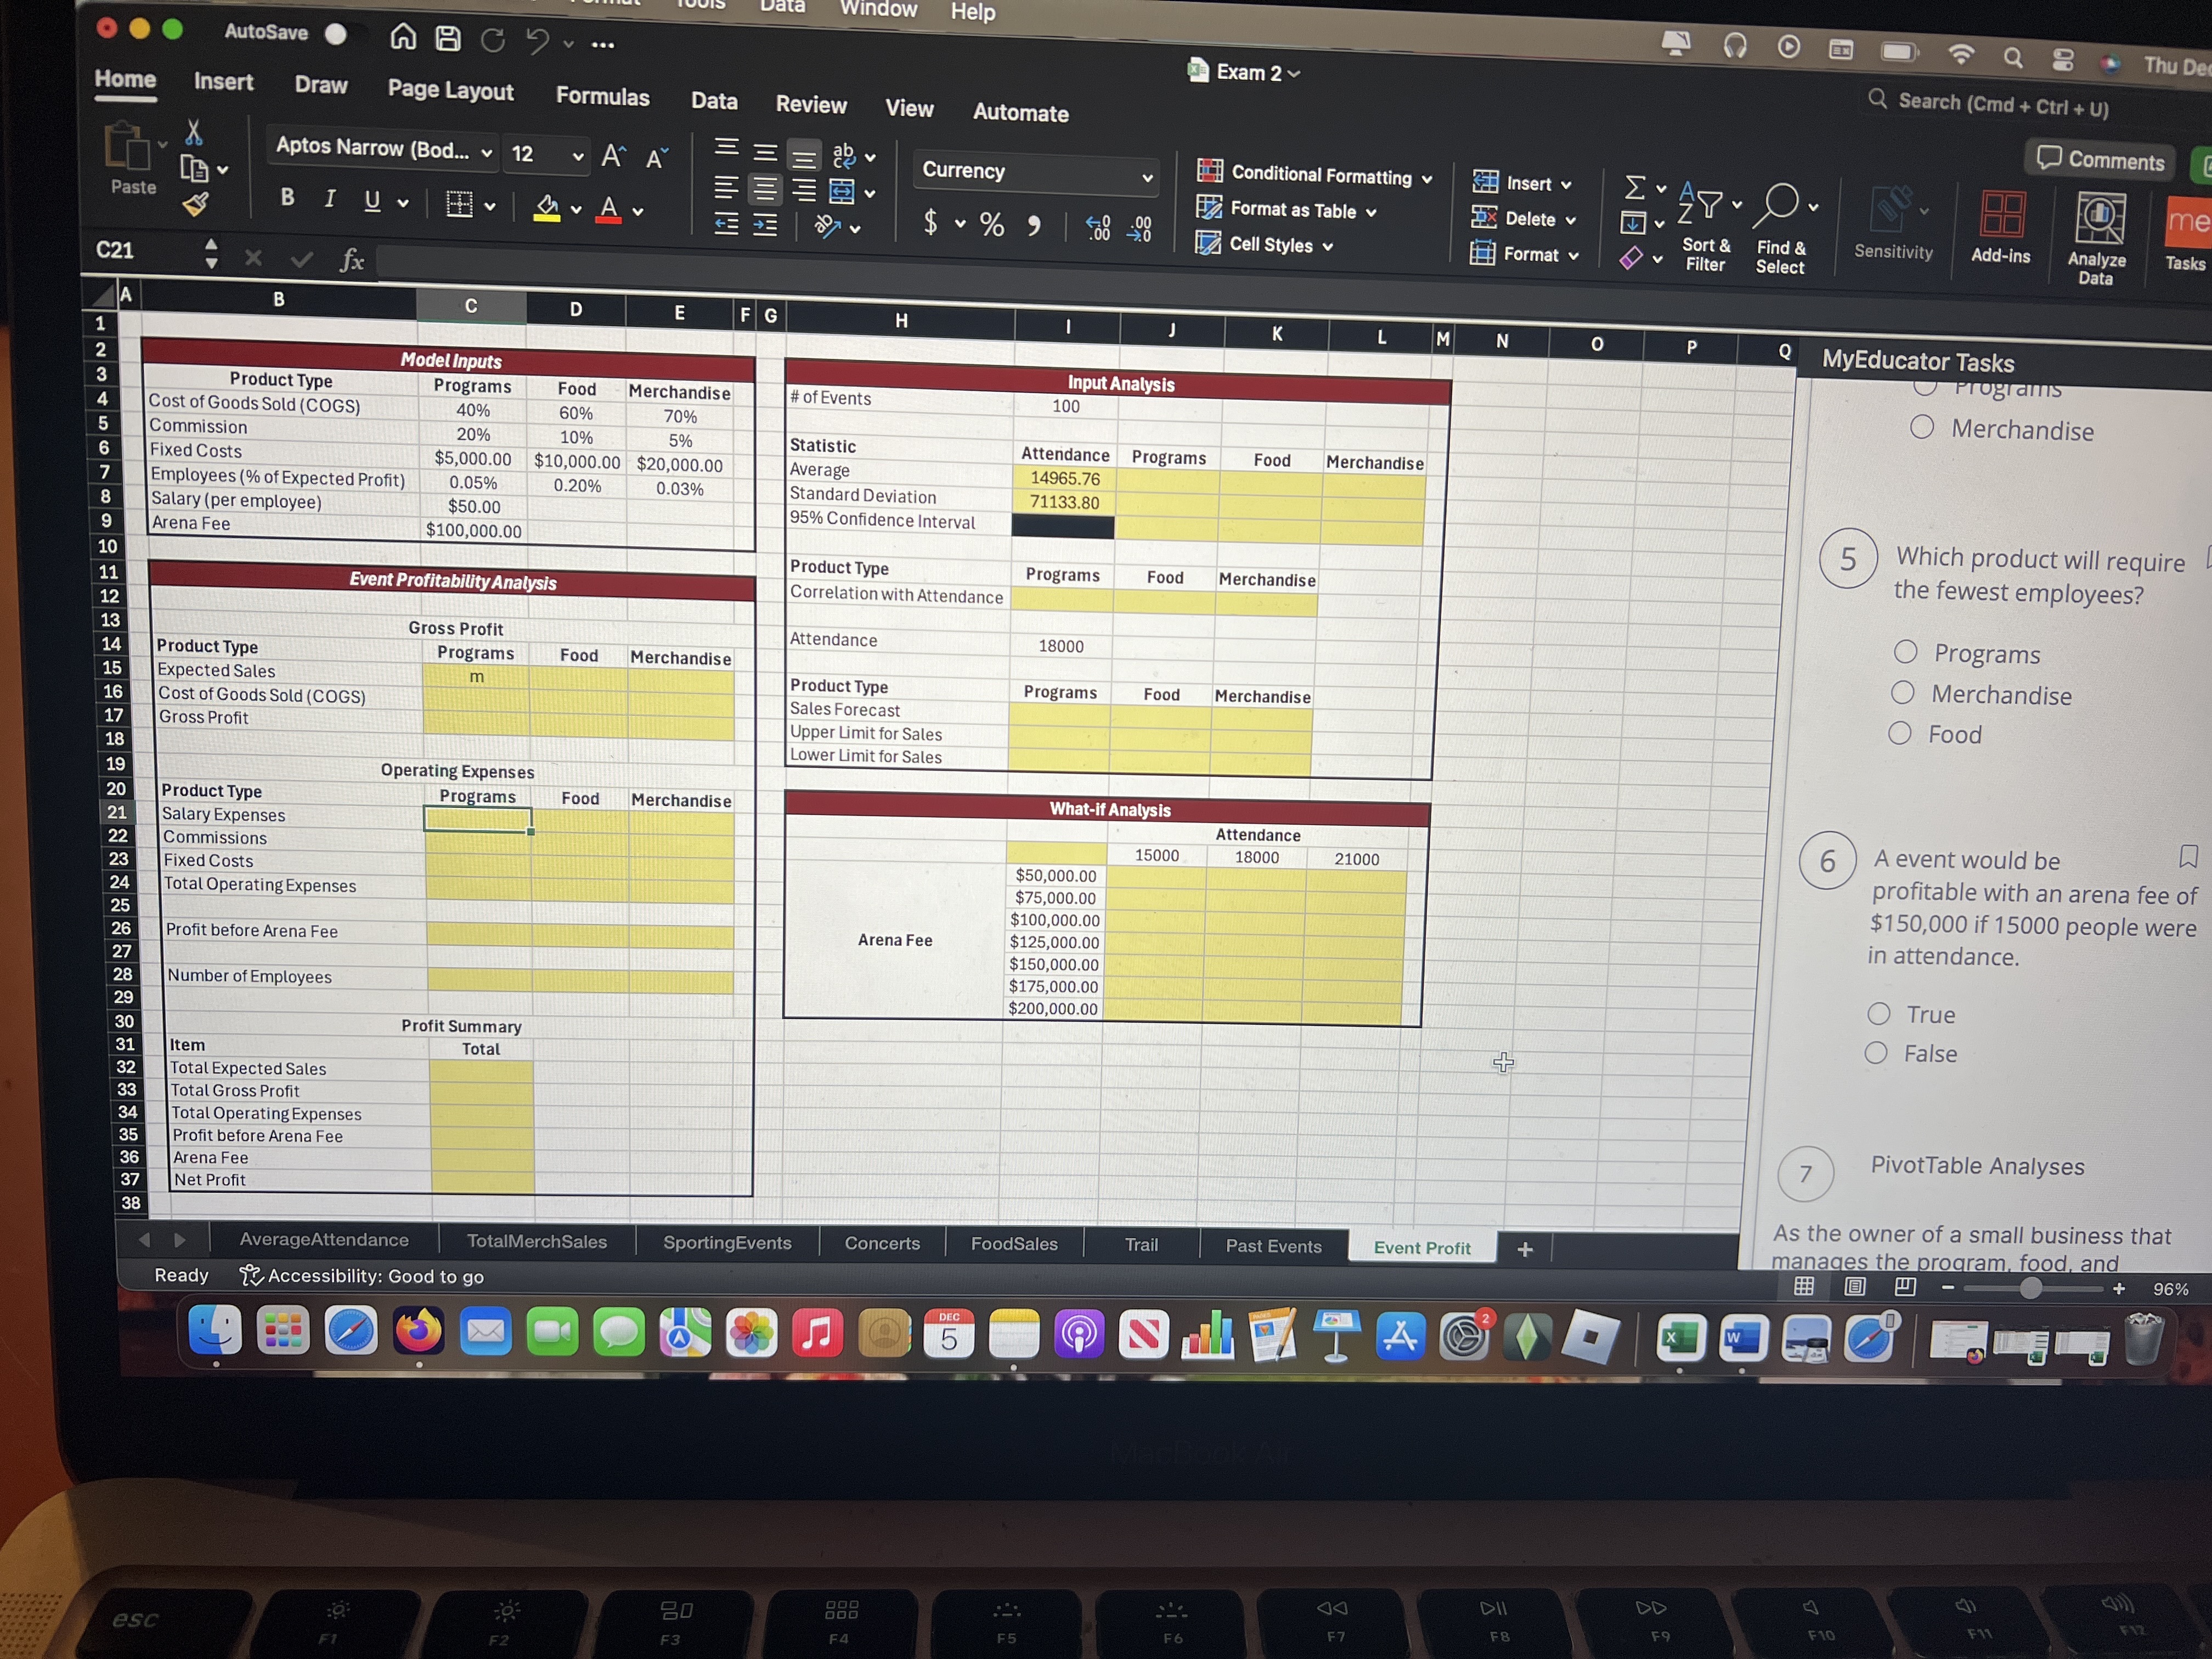
Excel File Edit View Insert Format L2000 C) GGG PP PP PP O e S S S R N A e AN ISR IS =k 3 b LS Auosave @ ") Insert Draw Page Layout Formulas Data Product Type Cost of Goods Sold (COGS) Commission Fixed Costs Employees (% of Expected Profit) Salary (per employee) Arena Fee Programs 40% 20% $5,000.00 0.05% $50.00 $100,000.00 Food Merchandise 60% 70% 10% 5% $10,000.00 $20,000.00 0.20% 0.03% Event Profitability Analysis Gross Profit Programs m Product Type Expected Sales Cost of Goods Sold (COGS) Gross Profit Food Merchandise Operating Expenses Product Type Programs Salary Expenses Commissions Fixed Costs Total Operating Expenses Food Merchandise Profit before Arena Fee Number of Employees Profit Summary Item Total Total Expected Sales Total Gross Profit Total Operating Expenses Profit before Arena Fee Arena Fee Net Profit T?/Accessi ity: Good to go LB L) TotalMerchSz Ready Data Window Help [0 Review View Automate ab, L PN $v% 9 [El conditional Formatting [ Format as Table v 1 i [Z cell styles v #of Events Statistic Average Standard Deviation 95% Confidence Interval Attendance 14965.76 71133.80 Programs Food Merchandise Product Type Programs Correlation with Attendance Merchandise Attendance 18000 Product Type Sales Forecast Upper Limit for Sales Lower Limit for Sales Programs Merchandise Attendance 18000 21000 $50,000.00 $75,000.00 $100,000.00 $125,000.00 $150,000.00 $175,000.00 $200,000.00 Arena Fee 2T 5] ko) Past Events Event Profit 008 m = =) Dec 5 8:04PM (SRETTE N M) g (I Comments (RS FIT @ LLe7s PEE] ez e R : PECCRY @ L0 CTRY DI o JOk LT E Y (o Filter Select gl R e LECELS MyEducator Tasks 15 In the "Input Analysis" section ~ of the spreadsheet model, calculate a sales forecast for each type of product if expected attendance at the future event is 18000 people. * Reference cell 113) (the attendance forecast) for your calculations. 16 16 In the "Input Analysis" section of the spreadsheet model, calculate the upper limit for your sales forecast for each type of product if expected attendance at the future event is 18000 people. Reference the confidence interval you created for your calculation. 6 17 In the "Input Analysis" section of the spreadsheet model, calculate the lower limit for your sales forecast for each type of product if expected attendance at the future event is 18000 people. Reference the confidence interval you created for your calculation. Edit View Insert Format Tools Data Window Help 8 Thu Dec 5 8:05PM AutoSave NBC v ... Exam 2 Q Search (Cmd + Ctri + U) Home Insert Draw Page Layout Formulas Data Review View Automate Comments Share Aptos Narrow (Bod... 29 v Currency Conditional Formatting Insert v EV A DV ZY ~ he Paste Format as Table Delete v IUV V Av $ ~ % " Cell Styles v Format v Sort & Find & Sensitivity Add-ins Analyze Tasks Filter Select Data C22 X fx C D E F G H M P MyEducator Tasks x Model Inputs Input Analysis Product Type Programs Food Merchandise # of Events 100 i Cost of Goods Sold (COGS) 40% 60% 70% 6 Commission 20% 10% 5% Statistic Attendance Programs Merchandise Fixed Costs $5,000.00 $10,000.00 $20,000.00 Average 14965.76 1.8 In the "Event Profitability Employees (% of Expected Profit) 0.05% 0.20% 0.03% Standard Deviation 71133.80 Analysis" section of the model, enter Salary (per employee) $50.00 95% Confidence Interval the expected sales for each product Arena Fee $100,000.00 Product Type Programs Food Merchandise type for this event by referencing your Event Profitability Analysis Correlation with Attendance sales forecast from the "Input Analysis" section of the model. Gross Profit Attendance 18000 Product Type Programs Food Merchandise 6 Expected Sales m Product Type Programs Food Merchandise Cost of Goods Sold (COGS) Sales Forecast 1.9 Calculate the cost of goods Gross Profit Upper Limit for Sales sold (COGS) for each product. Lower Limit for Sales . The COGS is calculated as the Operating Expenses Product Type Programs Food Merchandise What-if Analysis expected sales for each product Salary Expenses Attendance type times the COGS percentage Commissions 15000 18000 21000 from the "Model Inputs" section of Fixed Costs $50,000.00 Total Operating Expenses $75,000.00 the model for that product type. $100,000.00 Profit before Arena Fee Arena Fee $125,000.00 $150,000.00 6 Number of Employees $175,000.00 $200,000.00 1.10 Calculate the Gross Profit for each product. The gross profit is 30 Profit Summary 31 Item Total calculated as the expected sales minus Total Expected Sales the COGS for each product. Total Gross Profit Total Operating Expenses 6 Profit before Arena Fee Arena Fee 1.11 Calculate the Commissions Net Profit 38 1.12 Enter the fixed costs for the Past Events + AverageAttendance TotalMerchSales SportingEvents Concerts FoodSales Trail Event Profit 96% Ready Accessibility: Good to go DEC 5 DD 20 888 esc F7 FB F10 F11 F12 F3 F4 F5 F6Excel File Edit View Insert Format Tools Data Window Help 0 7 1 8 . Thu Dec 5 8:06PM AutoSave Exam 2 Q Search (Cmd + Ctrl + U) Home Insert Draw Page Layout Formulas Data Review View Automate Comments Share Aptos Narrow (Bod... v 12 ab v Currency Conditional Formatting Insert v ne Paste Format as Table Delete v IUV MV Av $ ~ % " Cell Styles v [ Format v DV Sort & Find & Sensitivity Add-ins Analyze Tasks Filter Select Data C2 X fx C E F G H M 0 P Q MyEducator Tasks X Model Inputs Input Analysis 6 Product Type Programs Food Merchandise # of Events 100 NOUAWNH Cost of Goods Sold (COGS) 40% 60% 70% 1.11 Calculate the Commissions Commission 20% 10% 5% Statistic Attendance Programs Food Merchandise paid for each product type. Fixed Costs $5,000.00 $10,000.00 $20,000.00 Average 14965.76 The commissions paid are Employees (% of Expected Profit) 0.05% 0.20% 0.03% Standard Deviation 71133.80 Salary (per employee) $50.00 95% Confidence Interval calculated as the expected sales Arena Fee 100,000.00 for each product type times the 10 Product Type Programs Food Merchandise commission % from the "Model Event Profitability Analysis Correlation with Attendance Inputs" section of the model. Gross Profit Attendance 18000 Product Type Programs Food Merchandise 6 Expected Sales m Product Type Programs Food Merchandise Cost of Goods Sold (COGS) Sales Forecast 1.12 Enter the fixed costs for the Gross Profit Upper Limit for Sales Lower Limit for Sales model. . Reference the Fixed Costs for each Operating Expenses Product Type Programs Food Merchandise What-if Analysis product type from the "Model ttendance Salary Expenses Inputs" section of the model 15000 18000 21000 Commissions 23 $50,000.00 Fixed Costs $75,000.00 Total Operating Expenses 6 $100,000.00 Arena Fee $125,000.00 1.13 Calculate the total operating Profit before Arena Fee $150,000.00 $175,000.00 expenses for each product type. Number of Employees $200,000.00 . This is the sum of Salary Expenses (which you have not yet Profit Summary Total calculated), Commissions, and the Item Total Expected Sales Fixed Costs for each product type. Total Gross Profit Total Operating Expenses Profit before Arena Fee 6 Arena Fee 1.14 Calculate the Profit before Net Profit Trail Past Events Event Profit + 1.15 Calculate the number of Concerts FoodSales 96% AverageAttendance TotalMerchSales SportingEvents 8 0 9 -- Ready Accessibility: Good to go O DEC 5 DII DD F11 F12 F10 80 F5 F7 F8 esc FI F2 F3[ 010 IR IR P g [ (Y Y [ RRRRB B &EYs oSN Excel File Edit View Insert Format R Lo " Wind AutoSave @ A P . e Insert ) @~ (Y E I LY IR Formulas Data Review View Aptos Narrow (Bod.. v 12 v A A 35 Mo RO Product Type Cost of Goods Sold (COGS) Commission Fixed Costs Employees (% of Expected Profit) Salary (per employee) Arena Fee Programs Food Merchandise 40% 60% 70% 20% 10% 5% $5,000.00 | $10,000.00 $20,000.00 0.05% 0.20% 0.03% $50.00 $100,000.00 # of Events Statistic Average Standard Deviation 95% Confidence Interval Product Type T T ETS Correlation with Attendance Gross Profit Programs m Product Type Expected Sales Cost of Goods Sold (COGS) Gross Profit Attendance Food Merchandise Product Type Sales Forecast Upper Limit for Sales Lower Limit for Sales Operating Expenses Product Type Programs Salary Expenses Commissions. Fixed Costs Total Operating Expenses. Food Merchandise Profit before Arena Fee L Arena Fee Number of Employees Profit Summary Item Total Total Expected Sales Total Gross Profit Total Operating Expenses Profit before Arena Fee Arena Fee Net Profit e 20 Ready % Accessibility: Good to go LleBO L L - Ll Automate (o111 Y Attendance 14965.76 71133.80 Programs 18000 Programs $50,000.00 $75,000.00 $100,000.00 $125,000.00 $150,000.00 $175,000.00 $200,000.00 [ T . SET A [E Conditional Formatting v [iZ Format as Table v @ Cell Styles v Programs Food Food 15000 Trail N N ow Help E LT 8 T RS o ELIE 2 L R R Food Merchandise Merchandise Merchandise Attendance 18000 21000 QO & Z:r"\\? pv Find & Select L Q Q search (Cmd + Ctrl + U) i Thu Dec 5 8:064 [SRICTY P Y, @ gl Analyze EEY PrIE] Sensitivity | Add-i 114 Calculate the Profit before Arena Fee for each product type. * This is the Gross Profit minus the Total Operating Expenses (including Salary Expenses - which you have not yet calculated) for each type of product. 6 115 Calculate the number of employees needed to work the event for each type of product. This is calculated as the Profit Before Arena Fee for each type of product times the Employees (% of Expected Profit) for each product type from the model inputs. Since you can't hire a fraction of an employee, be sure to round your calculations up to the next whole employee. 6 Event Profit S 116 Calculate the Salary Expenses v Excel File Edit Insert Format Tools Data Window Help 6 9 8 7 Thu Dec 5 8:07 AutoSave WAC ? v ... Exam 2 Q Search (Cmd + Ctri + U) Home Insert Draw Page Layout Formulas Data Review View Automate Comments Share Aptos Narrow (Bod... v 12 AA 28 v Currency Conditional Formatting Insert v EV A he 3 V Paste Format as Table Delete BIU MV Av $ v % " 408 08 Cell Styles v Sort & Find & Add-ins Analyze Format v Sensitivity Tasks Filter Select Data C21 fx B C D E F G H M N 0 P Q MyEducator Tasks Model Inputs Input Analysis Product Type Programs Food Merchandise # of Events 1.16 Calculate the Salary Expenses 100 Cost of Goods Sold (COGS) 40% 60% 70% for each product type Commission 20% 10% 5% Statistic Attendance Programs Food Merchandise . This is calculated as the number of Q D VOU A W N Fixed Costs $5,000.00 $10,000.00 $20,000.00 Average 14965.76 employees needed for each Employees (% of Expected Profit) 0.05% 0.20% 0.03% Standard Deviation 71133.80 Salary (per employee) $50.00 95% Confidence Interval product type times the Salary (per Arena Fee $100,000.00 employee) in the model inputs Product Type Programs Food Merchandise employees make the same salary Event Profitability Analysis Correlation with Attendance despite the product type). Gross Profit Attendance 18000 Note that this will create a circular Product Type Programs Food Merchandise reference in your spreadsheet. Expected Sales Product Type Programs Food Merchandise You will need to change the options Cost of Goods Sold (COGS) Sales Forecast Gross Profit Upper Limit for Sales in Excel to appropriately account Lower Limit for Sales for the circular reference. Operating Expenses Product Type Programs Food Merchandise What-if Analysis Salary Expenses Attendance 6 Commissions 15000 18000 21000 Fixed Costs $50,000.00 1.17 In the Profit Summary section Total Operating Expenses $75,000.00 of the worksheet, calculate the total $100,000.00 Arena Fee expected sales for all products by Profit before Arena Fee $125,000.00 $150,000.00 referencing the Expected Sales for each Number of Employees $175,000.00 + product in the Gross Profit section. $200,000.00 Profit Summary 2 Item Total Total Expected Sales 1.18 In the Profit Summary section Total Gross Profit of the worksheet, calculate the total Total Operating Expenses gross profit for all products by Profit before Arena Fee referencing the Gross Profit for each Arena Fee Net Profit product in the Gross Profit section. SportingEvents Concerts Trail Event Profit + 2 AverageAttendance TotalMerchSales FoodSales Past Events 96% Ready Accessibility: Good to go DEC 5 A DII DD 80 888 esc :9: F10 F2 F3 F4 F5 F6 F7 F1Excel File Edit View Insert Format Tools Data Window Help Q 8 Thu Dec 5 8:08 PM AutoSave ... Exam 2 Q Search (Cmd + Ctri + U) Home Insert Draw Page Layout Formulas Data Review View Automate Comments Share Aptos Narrow (Bod... v 12 A A 29 v Currency Conditional Formatting Insert EVA me Paste BIUV Format as Table Delete v % 9 08 40 Cell Styles v Sort & [Format v Find & Sensitivity Add-ins Analyz Tasks Filter Select Data C21 X fx B C D E F G H M N Q MyEducator Tasks Model Inputs Input Analysis Product Type Programs Food Merchandise # of Events 100 i Cost of Goods Sold (COGS) 40% 60% 70% 1.19 Complete the Total Operating Commission 20% 10% 5% Statistic Attendance Programs Food Merchandise Expenses portion of the Profit Summary Fixed Costs $5,000.00 $10,000.00 $20,000.00 Average 14965.76 section of the worksheet by calculating Employees (% of Expected Profit) 0.05% 0.20% 0.03% Standard Deviation 71133.80 Salary (per employee) $50.00 95% Confidence Interval the Total Operating Expenses for all Arena Fee $100,000.00 products from the Operating Expenses Product Type Programs Food Merchandise section of the model. Event Profitability Analysis Correlation with Attendance 12 2 Gross Profit Attendance 18000 Product Type Programs Food Merchandise 1.20 Complete the Profit before Expected Sales m Product Type Programs Food Merchandise Arena Fee portion of the Profit Cost of Goods Sold (COGS) Sales Forecast Summary section of the worksheet by Gross Profit Upper Limit for Sales Lower Limit for Sales calculating the Total Profit before Arena Operating Expenses Fee for all products from the Operating Product Type Programs Food Merchandise What-if Analysis Expenses section of the model. Salary Expenses Attendance Commissions 15000 18000 21000 + 2 Fixed Costs $50,000.00 Total Operating Expenses $75,000.00 1.21 Complete the Arena Fee $100,000.00 portion of the Profit Summary section of Arena Fee $125,000.00 Profit before Arena Fee $150,000.00 the model by referencing the Arena fee $175,000.00 from the Model Inputs. Number of Employees $200,000.00 Profit Summary 2 Item Total 1.22 Calculate the Net Profit Expected Sales portion of the Profit Summary section of Total Gross Profit Total Operating Expenses the model by subtracting the Arena Fee Profit before Arena Fee from the Profit before Arena Fee. Arena Fee Net Profit 2 FoodSales Trail Past Events Event Profit + 1.23 Complete the data table in the ~ SportingEvents Concerts AverageAttendance TotalMerchSales 96% Ready Accessibility: Good to go DEC 5Excel File View Insert Format Tools Data Window Help Thu Dec 5 8:10P AutoSave Exam 2 Q Search (Cmd + Ctrl + U) Home Insert Draw Page Layout Formulas Data Review View Automate Comments Share Aptos Narrow (Bod... v 12 ab Currency Conditional Formatting v Insert v Ev Format as Table Delete v v Z me Paste IUV Ev MV Av v % " Cell Styles v Format v DV Sort & Find & Sensitivity Add-ins Analyze Tasks Filter Select Data C21 X fx B C D F G H K M N P Q MyEducator Tasks Model Inputs Input Analysis Product Type Programs Food Merchandise # of Events the model by subtracting the Arena Fee i 100 Cost of Goods Sold (COGS) 40% 60% 70% from the Profit before Arena Fee. Commission 20% 10% 5% Statistic Attendance Programs Merchandise Fixed Costs $5,000.00 $10,000.00 $20,000.00 2 Average 14965.76 Employees (% of Expected Profit) 0.05% 0.20% 0.03% Standard Deviation 71133.80 1.23 Complete the data table in the Salary (per employee) $50.00 5% Confidence Interval Arena Fee $100,000.00 "What-if Analysis" section of the 10 Product Type Programs Food Merchandise worksheet to compute the Net Profit for 11 Event Profitability Analysis Correlation with Attendance various values of attendance and the 12 13 Arena Fee. Gross Profit Attendance 18000 Product Type Programs Food Merchandise 20 Expected Sales m Product Type Programs Food Merchandise 16 Cost of Goods Sold (COGS) Sales Forecast 17 Gross Profit Upper Limit for Sales Lower Limit for Sales Operating Expenses Product Type Food Merchandise What-if Analysis 2 The sales for which Programs Salary Expenses Attendance product type are most highly 15000 18000 21000 Commissions correlated with attendance? Fixed Costs $50,000.00 Total Operating Expenses $75,000.00 $100,000.00 Programs Profit before Arena Fee Arena Fee $125,000.00 $150,000.00 O Merchandise $175,000.00 Number of Employees $200,000.00 Food Profit Summary Item Total Total Expected Sales Total Gross Profit How likely is it that food Total Operating Expenses Profit before Arena Fee sales would exceed $220,000 if Arena Fee + attendance is 18000? Net Profit 38 FoodSales Trail + SportingEvents Concerts Past Events Event Profit O Less than a 5% chance AverageAttendance TotalMerchSales - + 96% Ready 1Accessibility: Good to go 5 DD DII DD A F12 888 FB F9 F10 80 F7 F5 esc F1 FZ F3Excel File Edit View Insert Format Tools Data Window Help Q 8 Thu Dec 5 AutoSave WBC ? v ... Exam 2 Q Search (Cmd + Ctri + U) Home Insert Draw Page Layout Formulas Data Review View Automate Comments S Aptos Narrow (Bod... v 12 AA cy v Currency Conditional Formatting Insert v he Format as Table Delete v Paste BIUV MV Av $ ~ % 9 Sort & Find & Sensitivity Add-ins Analyze Tasks Cell Styles v Format DV Filter Select Data C21 fx B C D G H M N 0 MyEducator Tasks Model Inputs Input Analysis Product Type Programs Food Merchandise # of Events 100 Cost of Goods Sold (COGS) 40% 60% 70% Commission 20% 10% 5% Statistic Attendance Programs Food Merchandise SO D VOU A W N Fixed Costs $5,000.00 $10,000.00 $20,000.00 Average 14965.76 How likely is it that food Employees (% of Expected Profit) 0.05% 0.20% 0.03% Standard Deviation 71133.80 95% Confidence Interval sales would exceed $220,000 if Salary (per employee) $50.00 Arena Fee $100,000.00 attendance is 18000? Product Type Programs Food Merchandise Event Profitability Analysis Correlation with Attendance Less than a 5% chance Gross Profit Attendance 18000 O Greater than a 5% Product Type Programs Food Merchandise Product Type Programs Food Merchandise chance Expected Sales m 16 Cost of Goods Sold (COGS) Sales Forecast Gross Profit Upper Limit for Sales About a 50% chance Lower Limit for Sales Greater than a 95% Operating Expenses Product Type Programs Food Merchandise What-if Analysis chance Salary Expenses Attendance 15000 18000 It is impossible to say Commissions 21000 Fixed Costs $50,000.00 Total Operating Expenses $75,000.00 $100,000.00 |Profit before Arena Fee Arena Fee $125,000.00 $150,000.00 $175,000.00 4 Which product generates Number of Employees $200,000.00 the largest gross profit? 30 Profit Summary 31 Food Item Total Total Expected Sales Programs Total Gross Profit Total Operating Expenses O Merchandise Profit before Arena Fee 36 Arena Fee 37 Net Profit Concerts FoodSales Trail Past Events Event Profit + AverageAttendance TotalMerchSales SportingEvents Which product will require Com 96% Ready Accessibility: Good to go DEC 5 80AutoSave @ Q Insert 4 M@y e DS i Product Type Cost of Goods Sold (COGS) Commission Fixed Costs Employees (% of Expected Profit) Salary (per employee) Arena Fee Product Type Expected Sales Cost of Goods Sold (COGS) Gross Profit Product Type Salary Expenses Commissions Fixed Costs Total Operating Expenses Profit before Arena Fee Number of Employees Item Total Expected Sales Total Gross Profit Total Operating Expenses Profit before Arena Fee Arena Fee Net Profit Ready LLT Page Layout Aptos Narrow (Bod... v 3 LA Event Profitability Analysis Gross Profit Operating Expenses Profit Summary window Help Formulas Data Review View Automate VAN (VT 100 L7 3T P2 \\ Search (Cmd i R ] (LT ETPRY }j Format as Table v LIRS E@ Insert v o N T =R R ELIE ST & Fiter Select ) Sensitivity LULELN Analyze Data Q MyEducator Tasks O Merchandise Programs Food Merchandise Which product will require l the fewest employees? Food Merchandise O Programs O Merchandise O Food Food Merchandise melams Food Merchandise s $50,000.00 $75,000.00 $100,000.00 $125,000.00 $150,000.00 $175,000.00 $200,000.00 ArenaFee Total Concerts LT %% Accessibility: Good to 1) L] o JeRala] -] Jo Attendance 18000 A event would be A profitable with an arena fee of $150,000 if 15000 people were in attendance. 15000 21000 O True O False 2 PivotTable Analyses As the owner of a small business that manages the program. food. and el LR Trail Events Event Profit 96%
Step by Step Solution
There are 3 Steps involved in it
1 Expert Approved Answer
Step: 1 Unlock
Question Has Been Solved by an Expert!
Get step-by-step solutions from verified subject matter experts
Step: 2 Unlock
Step: 3 Unlock
Students Have Also Explored These Related Accounting Questions!