Question: Excel File Edit View Insert Format Tools Data Window Help Cas Home Insert Page Layout Formulas Data Review View Colors Themes Aa Fonts Margins Orientation
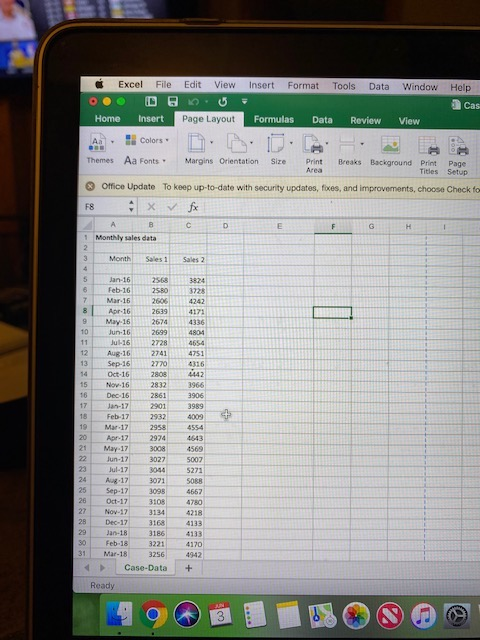
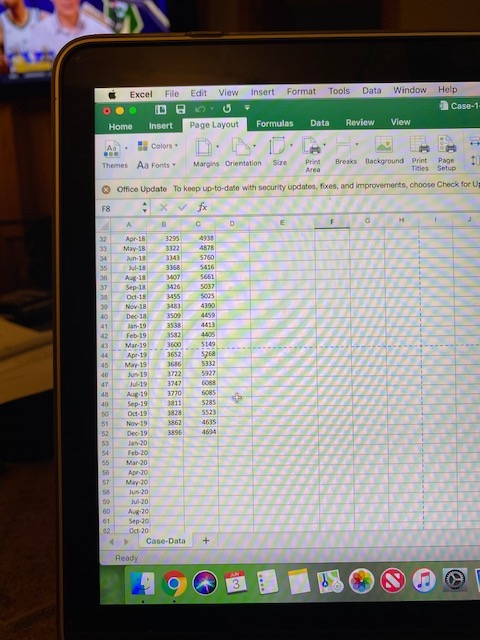
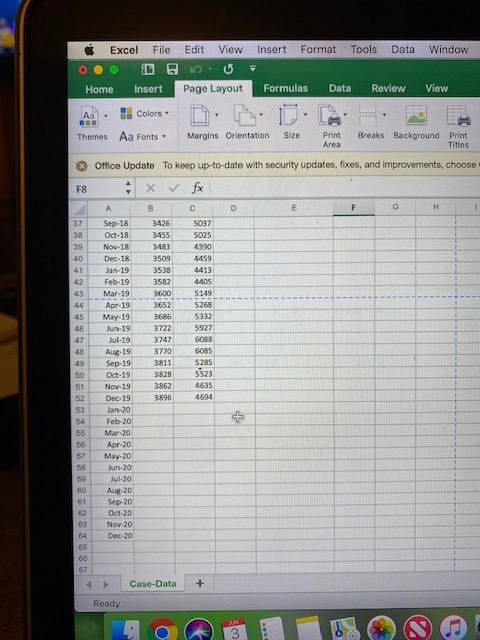
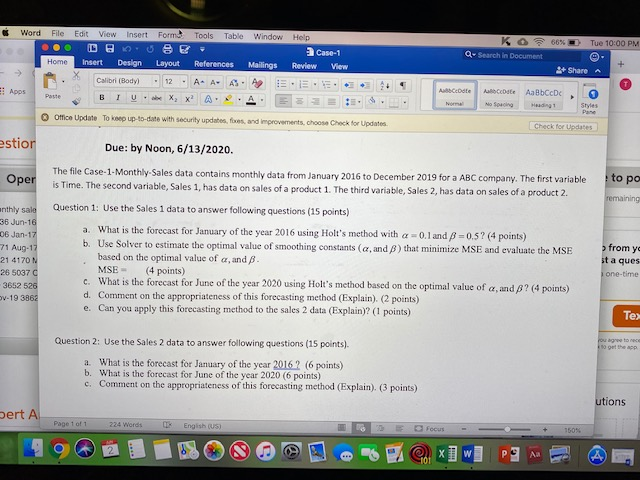
Excel File Edit View Insert Format Tools Data Window Help Cas Home Insert Page Layout Formulas Data Review View Colors Themes Aa Fonts Margins Orientation Size Print Area Breaks Background Print Page Titles Setup * Office Update To keep up-to-date with security updates, foxes, and improvements, choose Check fo F8 D E F H Sales 2 3824 3728 4242 4171 4336 4804 4654 4751 B 1 Monthly sales data 2 3 Month Sales 1 4 5 Jan-16 2568 6 Feb-16 2580 7 Mar.16 2606 8 Apr 16 2639 9 May 16 2674 10 Jun-16 2699 11 Ju1-16 2728 12 Aug-16 2741 13 Sep-16 2770 Oct-16 2808 15 Nov.16 2832 16 Dec 16 2861 17 Jan-17 2901 18 Feb-17 2932 19 Mar-17 2958 Apr 12 2974 21 May-17 3008 Jun-17 3027 23 Jul-17 3044 24 Aug 17 3071 25 Sep-17 3098 26 Oct-17 3108 Nov-17 3134 28 Dec-17 3168 29 Jan-18 3186 30 Feb-18 3221 31 Mar-18 3256 Case-Data + 4442 3966 3906 3989 4009 4554 4643 4569 5007 5271 SOBB 4667 4780 4218 4133 4133 4170 4942 + Ready . 2 Excel File Edit View Insert Format Tools Data Window Help Case-1 Home Insert Page Layout Formulas Data Review View Colors Themes Aa Fonts Margins Orientation Size Print Breaks Background Print Page Area Tities Setup Office Update To keep up-to-date with security updates, fixes, and improvements, choose Check for Us F8 Xfx B C D F G 32 Apr 18 3295 30 May 18 34 Pun-18 5760 35 18 3358 5416 38 3407 5661 37 Sep-18 3426 5037 Oct.1 3455 Nov.18 4390 40 Dec 18 3509 4459 41 3538 42 Feb-19 4405 43 Mar 19 3600 Apr-19 5268 45 May 19 5332 46 Jun 19 3722 5927 47 Jul-19 3747 Aug-19 3770 6085 Sep-19 3811 5285 50 1828 5523 51 Nov 19 4615 52 Dec 19 3895 4694 20 54 Feb-20 55 Mar 20 56 Ape 20 57 May 20 50 Jus 20 50 Jul 20 60 A 20 61 Sep-20 12 Oct-20 Case-Data + Ready BOB 49 Dan 19 Window Excel File Edit View Insert Format Tools Data DU Home Insert Page Layout Formulas Data Review View Aa Colors Themes Aa Fonts Margins Orientation Size Print Area Breaks Background Print Titles X Office Update To keep up-to-date with security updates, fixes, and improvements, choose x fx F8 B D E F 37 3.8 39 40 41 42. 43 44 Sep-18 Oct-18 Nov-18 Dec-18 Jan-19 Feb-19 Mar-19 Apr-19 May-19 Jun-19 Jul-19 Aug-19 Sep-19 Oct-19 Nov.19 Dec-19 Jan-20 Feb-20 Mar-20 Apr. 20 May-20 Jun-20 Jul-20 Aug 20 Sep-20 Oct-20 Nov.20 Dec-20 3426 3455 3483 3509 3538 3582 3600 3652 3686 3722 3747 3770 3811 3828 3862 3896 5037 S025 4390 4459 4413 4405 5149 5268 5332 5927 6088 6085 5285 5523 4635 4694 45 46 47 48 49 50 51 52 53 54 55 56 57 58 59 00 + 61 62 83 64 65 65 Case-Data + Ready Word File Edit View Insert Form Tools Table Window Help Case-1 References Mailings Review View KO 66% Tue 10:00 PM Q- Search in Document 3+ Share Home Insert Design Layout E AOS Calibri (Body) 12 - A A AS I U. X, XA Alcoote Alte Aa Bbc Paste ma Styles Office Update To keep up to date with security updates and improvements, choose Check for Updates Check for Updates estion Oper to po remaining enthly sale 36 Jun-16 06 Jan-17 71 Aug-12 21 4170 N 26 5037 C -3652 526 OV-19 3862 Due: by Noon, 6/13/2020. The file case-1- Monthly Sales data contains monthly data from January 2016 to December 2019 for a ABC company. The first variable is Time. The second variable, Sales 1, has data on sales of a product 1. The third variable, Sales 2, has data on sales of a product 2. Question 1: Use the Sales 1 data to answer following questions (15 points) a. What is the forecast for January of the year 2016 using Holt's method with a = 0.1 and 3 = 0.5? (4 points) b. Use Solver to estimate the optimal value of smoothing constants (a, and that minimize MSE and evaluate the MSE based on the optimal value of a, and 8. MSE (4 points) c. What is the forecast for June of the year 2020 using Holt's method based on the optimal value of aand 8? (4 points) d. Comment on the appropriateness of this forecasting method (Explain) (2 points) e. Can you apply this forecasting method to the sales 2 data (Explain)? (1 points) from yc sta ques i one-time Te> ou agree to rece 50 g the Question 2: Use the sales 2 data to answer following questions (15 points). a. What is the forecast for January of the year 2016? (6 points) b. What is the forecast for June of the year 2020 (6 points) c. Comment on the appropriateness of this forecasting method (Explain). (3 points) utions Dert A Page 1 of 1 224 Words . English (US) 1504 le X W Ma 101 Excel File Edit View Insert Format Tools Data Window Help Cas Home Insert Page Layout Formulas Data Review View Colors Themes Aa Fonts Margins Orientation Size Print Area Breaks Background Print Page Titles Setup * Office Update To keep up-to-date with security updates, foxes, and improvements, choose Check fo F8 D E F H Sales 2 3824 3728 4242 4171 4336 4804 4654 4751 B 1 Monthly sales data 2 3 Month Sales 1 4 5 Jan-16 2568 6 Feb-16 2580 7 Mar.16 2606 8 Apr 16 2639 9 May 16 2674 10 Jun-16 2699 11 Ju1-16 2728 12 Aug-16 2741 13 Sep-16 2770 Oct-16 2808 15 Nov.16 2832 16 Dec 16 2861 17 Jan-17 2901 18 Feb-17 2932 19 Mar-17 2958 Apr 12 2974 21 May-17 3008 Jun-17 3027 23 Jul-17 3044 24 Aug 17 3071 25 Sep-17 3098 26 Oct-17 3108 Nov-17 3134 28 Dec-17 3168 29 Jan-18 3186 30 Feb-18 3221 31 Mar-18 3256 Case-Data + 4442 3966 3906 3989 4009 4554 4643 4569 5007 5271 SOBB 4667 4780 4218 4133 4133 4170 4942 + Ready . 2 Excel File Edit View Insert Format Tools Data Window Help Case-1 Home Insert Page Layout Formulas Data Review View Colors Themes Aa Fonts Margins Orientation Size Print Breaks Background Print Page Area Tities Setup Office Update To keep up-to-date with security updates, fixes, and improvements, choose Check for Us F8 Xfx B C D F G 32 Apr 18 3295 30 May 18 34 Pun-18 5760 35 18 3358 5416 38 3407 5661 37 Sep-18 3426 5037 Oct.1 3455 Nov.18 4390 40 Dec 18 3509 4459 41 3538 42 Feb-19 4405 43 Mar 19 3600 Apr-19 5268 45 May 19 5332 46 Jun 19 3722 5927 47 Jul-19 3747 Aug-19 3770 6085 Sep-19 3811 5285 50 1828 5523 51 Nov 19 4615 52 Dec 19 3895 4694 20 54 Feb-20 55 Mar 20 56 Ape 20 57 May 20 50 Jus 20 50 Jul 20 60 A 20 61 Sep-20 12 Oct-20 Case-Data + Ready BOB 49 Dan 19 Window Excel File Edit View Insert Format Tools Data DU Home Insert Page Layout Formulas Data Review View Aa Colors Themes Aa Fonts Margins Orientation Size Print Area Breaks Background Print Titles X Office Update To keep up-to-date with security updates, fixes, and improvements, choose x fx F8 B D E F 37 3.8 39 40 41 42. 43 44 Sep-18 Oct-18 Nov-18 Dec-18 Jan-19 Feb-19 Mar-19 Apr-19 May-19 Jun-19 Jul-19 Aug-19 Sep-19 Oct-19 Nov.19 Dec-19 Jan-20 Feb-20 Mar-20 Apr. 20 May-20 Jun-20 Jul-20 Aug 20 Sep-20 Oct-20 Nov.20 Dec-20 3426 3455 3483 3509 3538 3582 3600 3652 3686 3722 3747 3770 3811 3828 3862 3896 5037 S025 4390 4459 4413 4405 5149 5268 5332 5927 6088 6085 5285 5523 4635 4694 45 46 47 48 49 50 51 52 53 54 55 56 57 58 59 00 + 61 62 83 64 65 65 Case-Data + Ready Word File Edit View Insert Form Tools Table Window Help Case-1 References Mailings Review View KO 66% Tue 10:00 PM Q- Search in Document 3+ Share Home Insert Design Layout E AOS Calibri (Body) 12 - A A AS I U. X, XA Alcoote Alte Aa Bbc Paste ma Styles Office Update To keep up to date with security updates and improvements, choose Check for Updates Check for Updates estion Oper to po remaining enthly sale 36 Jun-16 06 Jan-17 71 Aug-12 21 4170 N 26 5037 C -3652 526 OV-19 3862 Due: by Noon, 6/13/2020. The file case-1- Monthly Sales data contains monthly data from January 2016 to December 2019 for a ABC company. The first variable is Time. The second variable, Sales 1, has data on sales of a product 1. The third variable, Sales 2, has data on sales of a product 2. Question 1: Use the Sales 1 data to answer following questions (15 points) a. What is the forecast for January of the year 2016 using Holt's method with a = 0.1 and 3 = 0.5? (4 points) b. Use Solver to estimate the optimal value of smoothing constants (a, and that minimize MSE and evaluate the MSE based on the optimal value of a, and 8. MSE (4 points) c. What is the forecast for June of the year 2020 using Holt's method based on the optimal value of aand 8? (4 points) d. Comment on the appropriateness of this forecasting method (Explain) (2 points) e. Can you apply this forecasting method to the sales 2 data (Explain)? (1 points) from yc sta ques i one-time Te> ou agree to rece 50 g the Question 2: Use the sales 2 data to answer following questions (15 points). a. What is the forecast for January of the year 2016? (6 points) b. What is the forecast for June of the year 2020 (6 points) c. Comment on the appropriateness of this forecasting method (Explain). (3 points) utions Dert A Page 1 of 1 224 Words . English (US) 1504 le X W Ma 101


