Question: Excel File Edit View Insert Format Tools Data Window Help zoom57% Fri May 5 9:42 PM AutoSave OFF Goslee- Project3ExcelWorkbook Home Insert Draw Page Layout
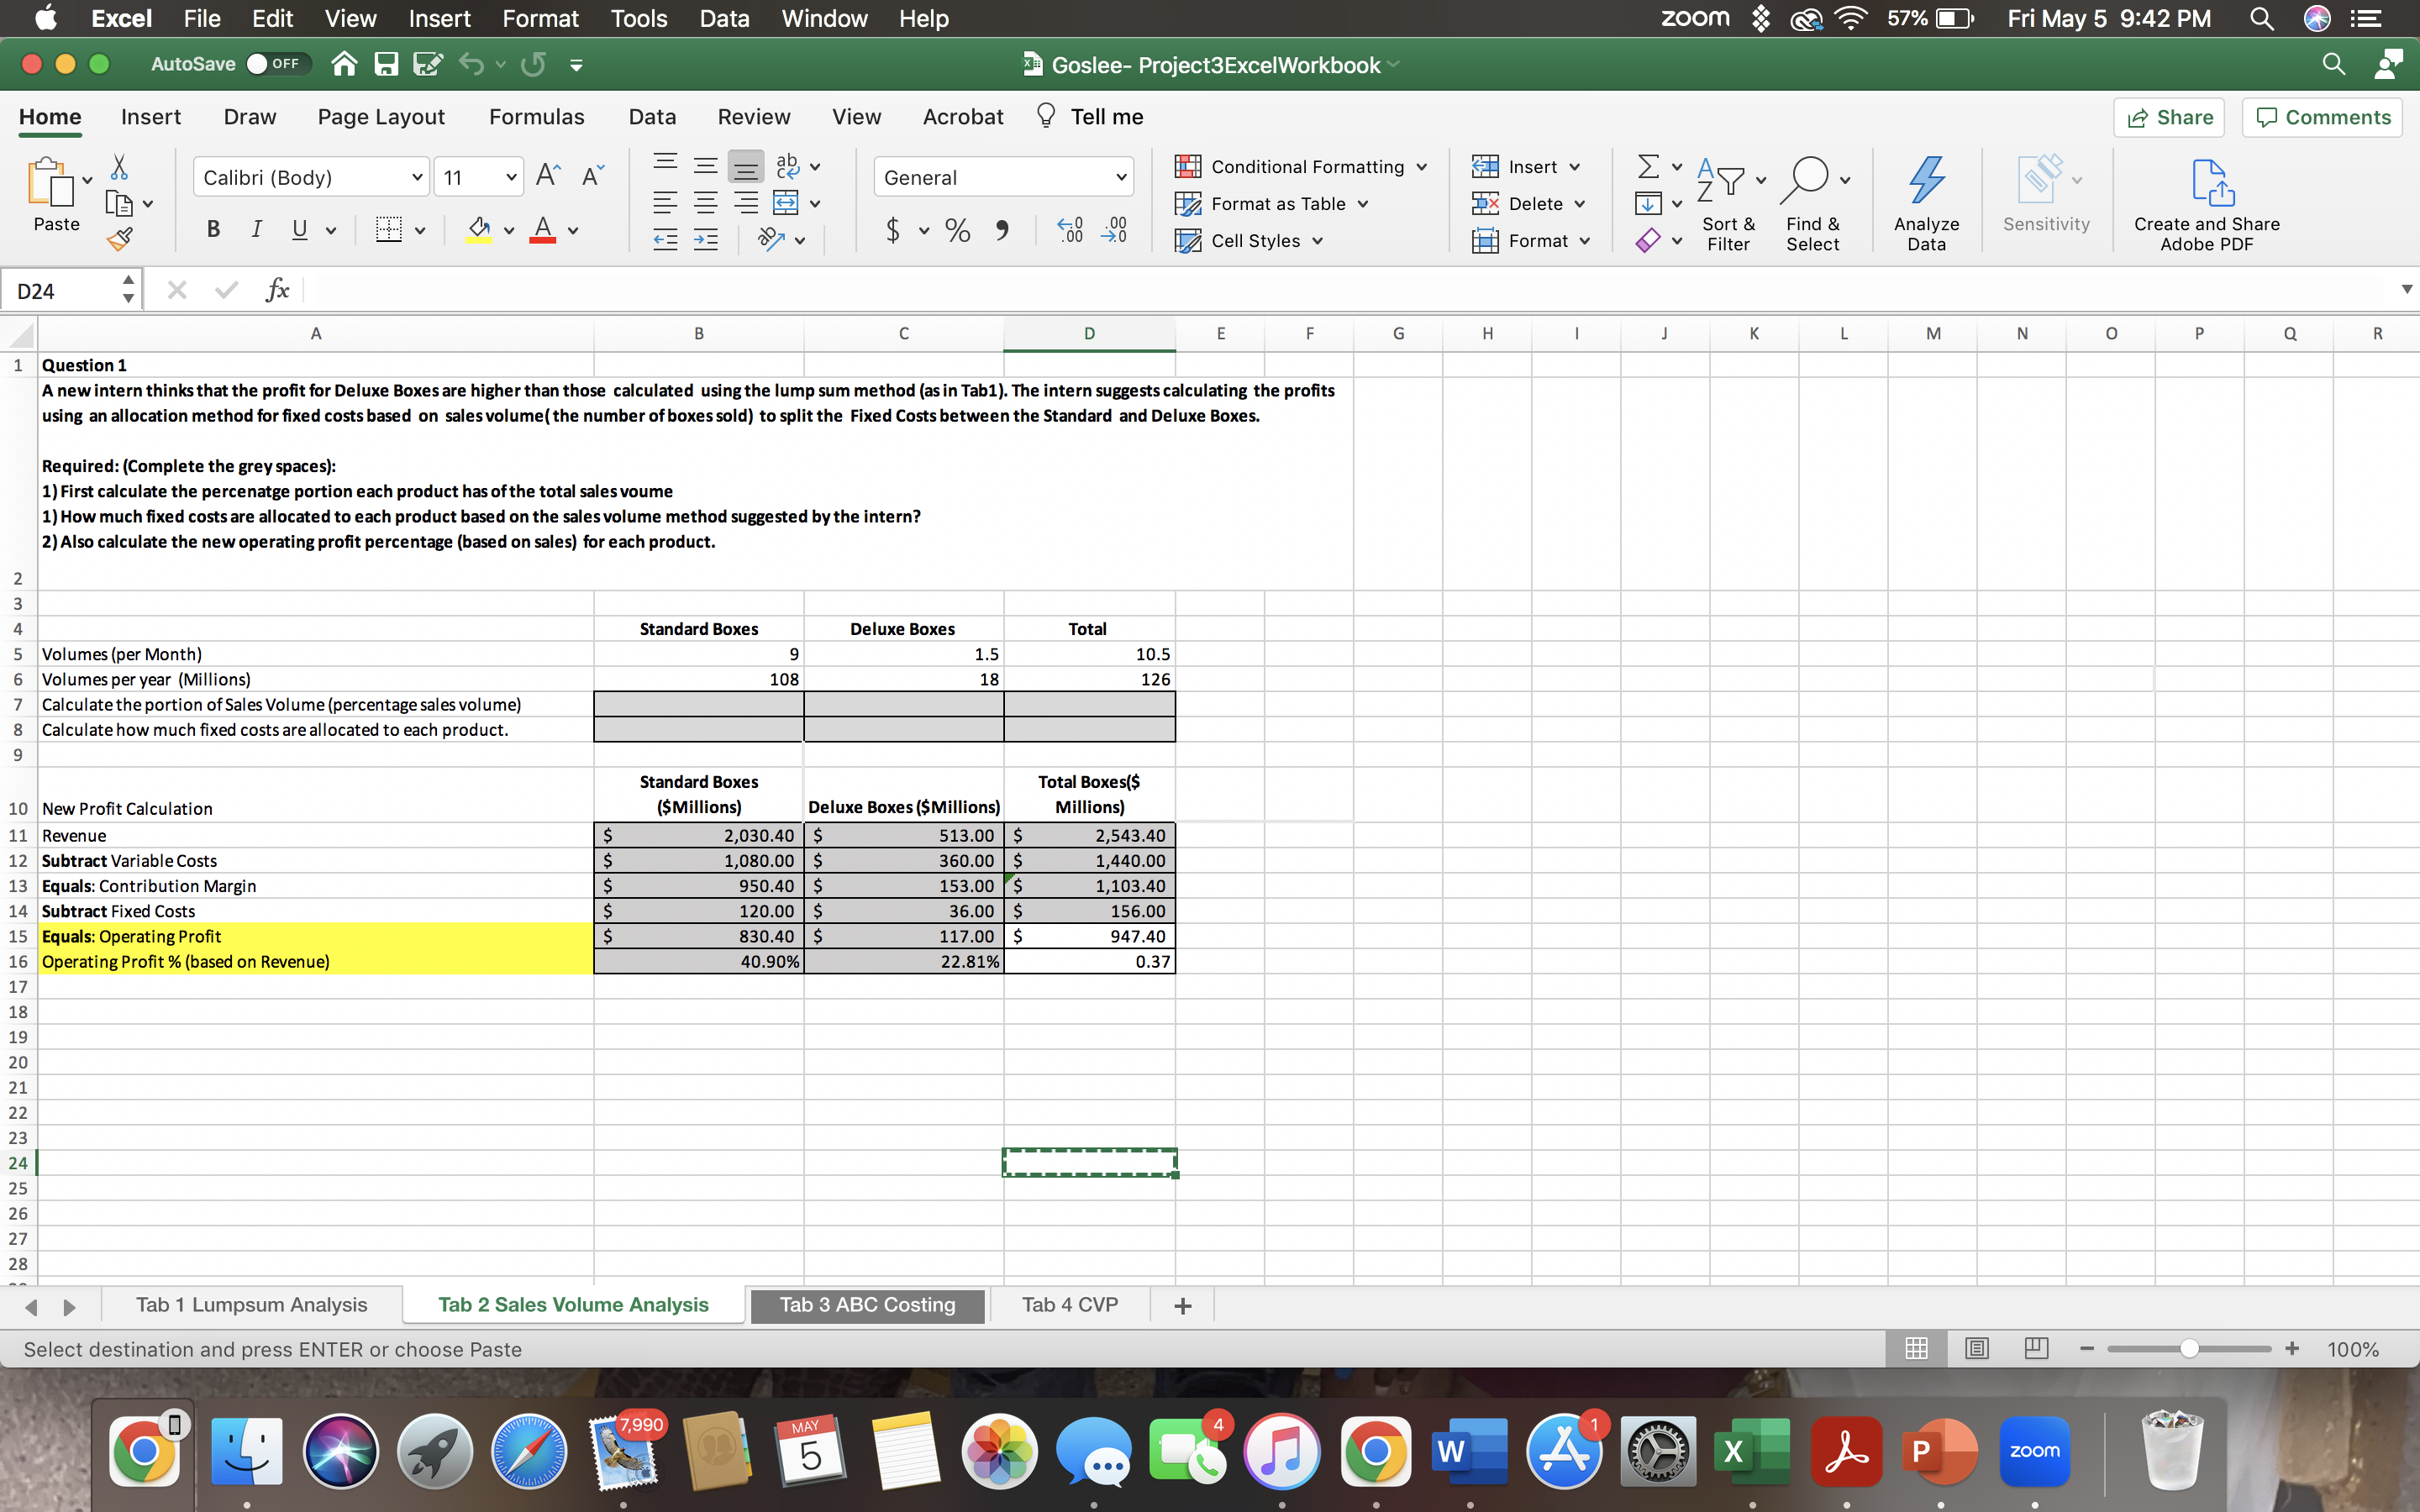
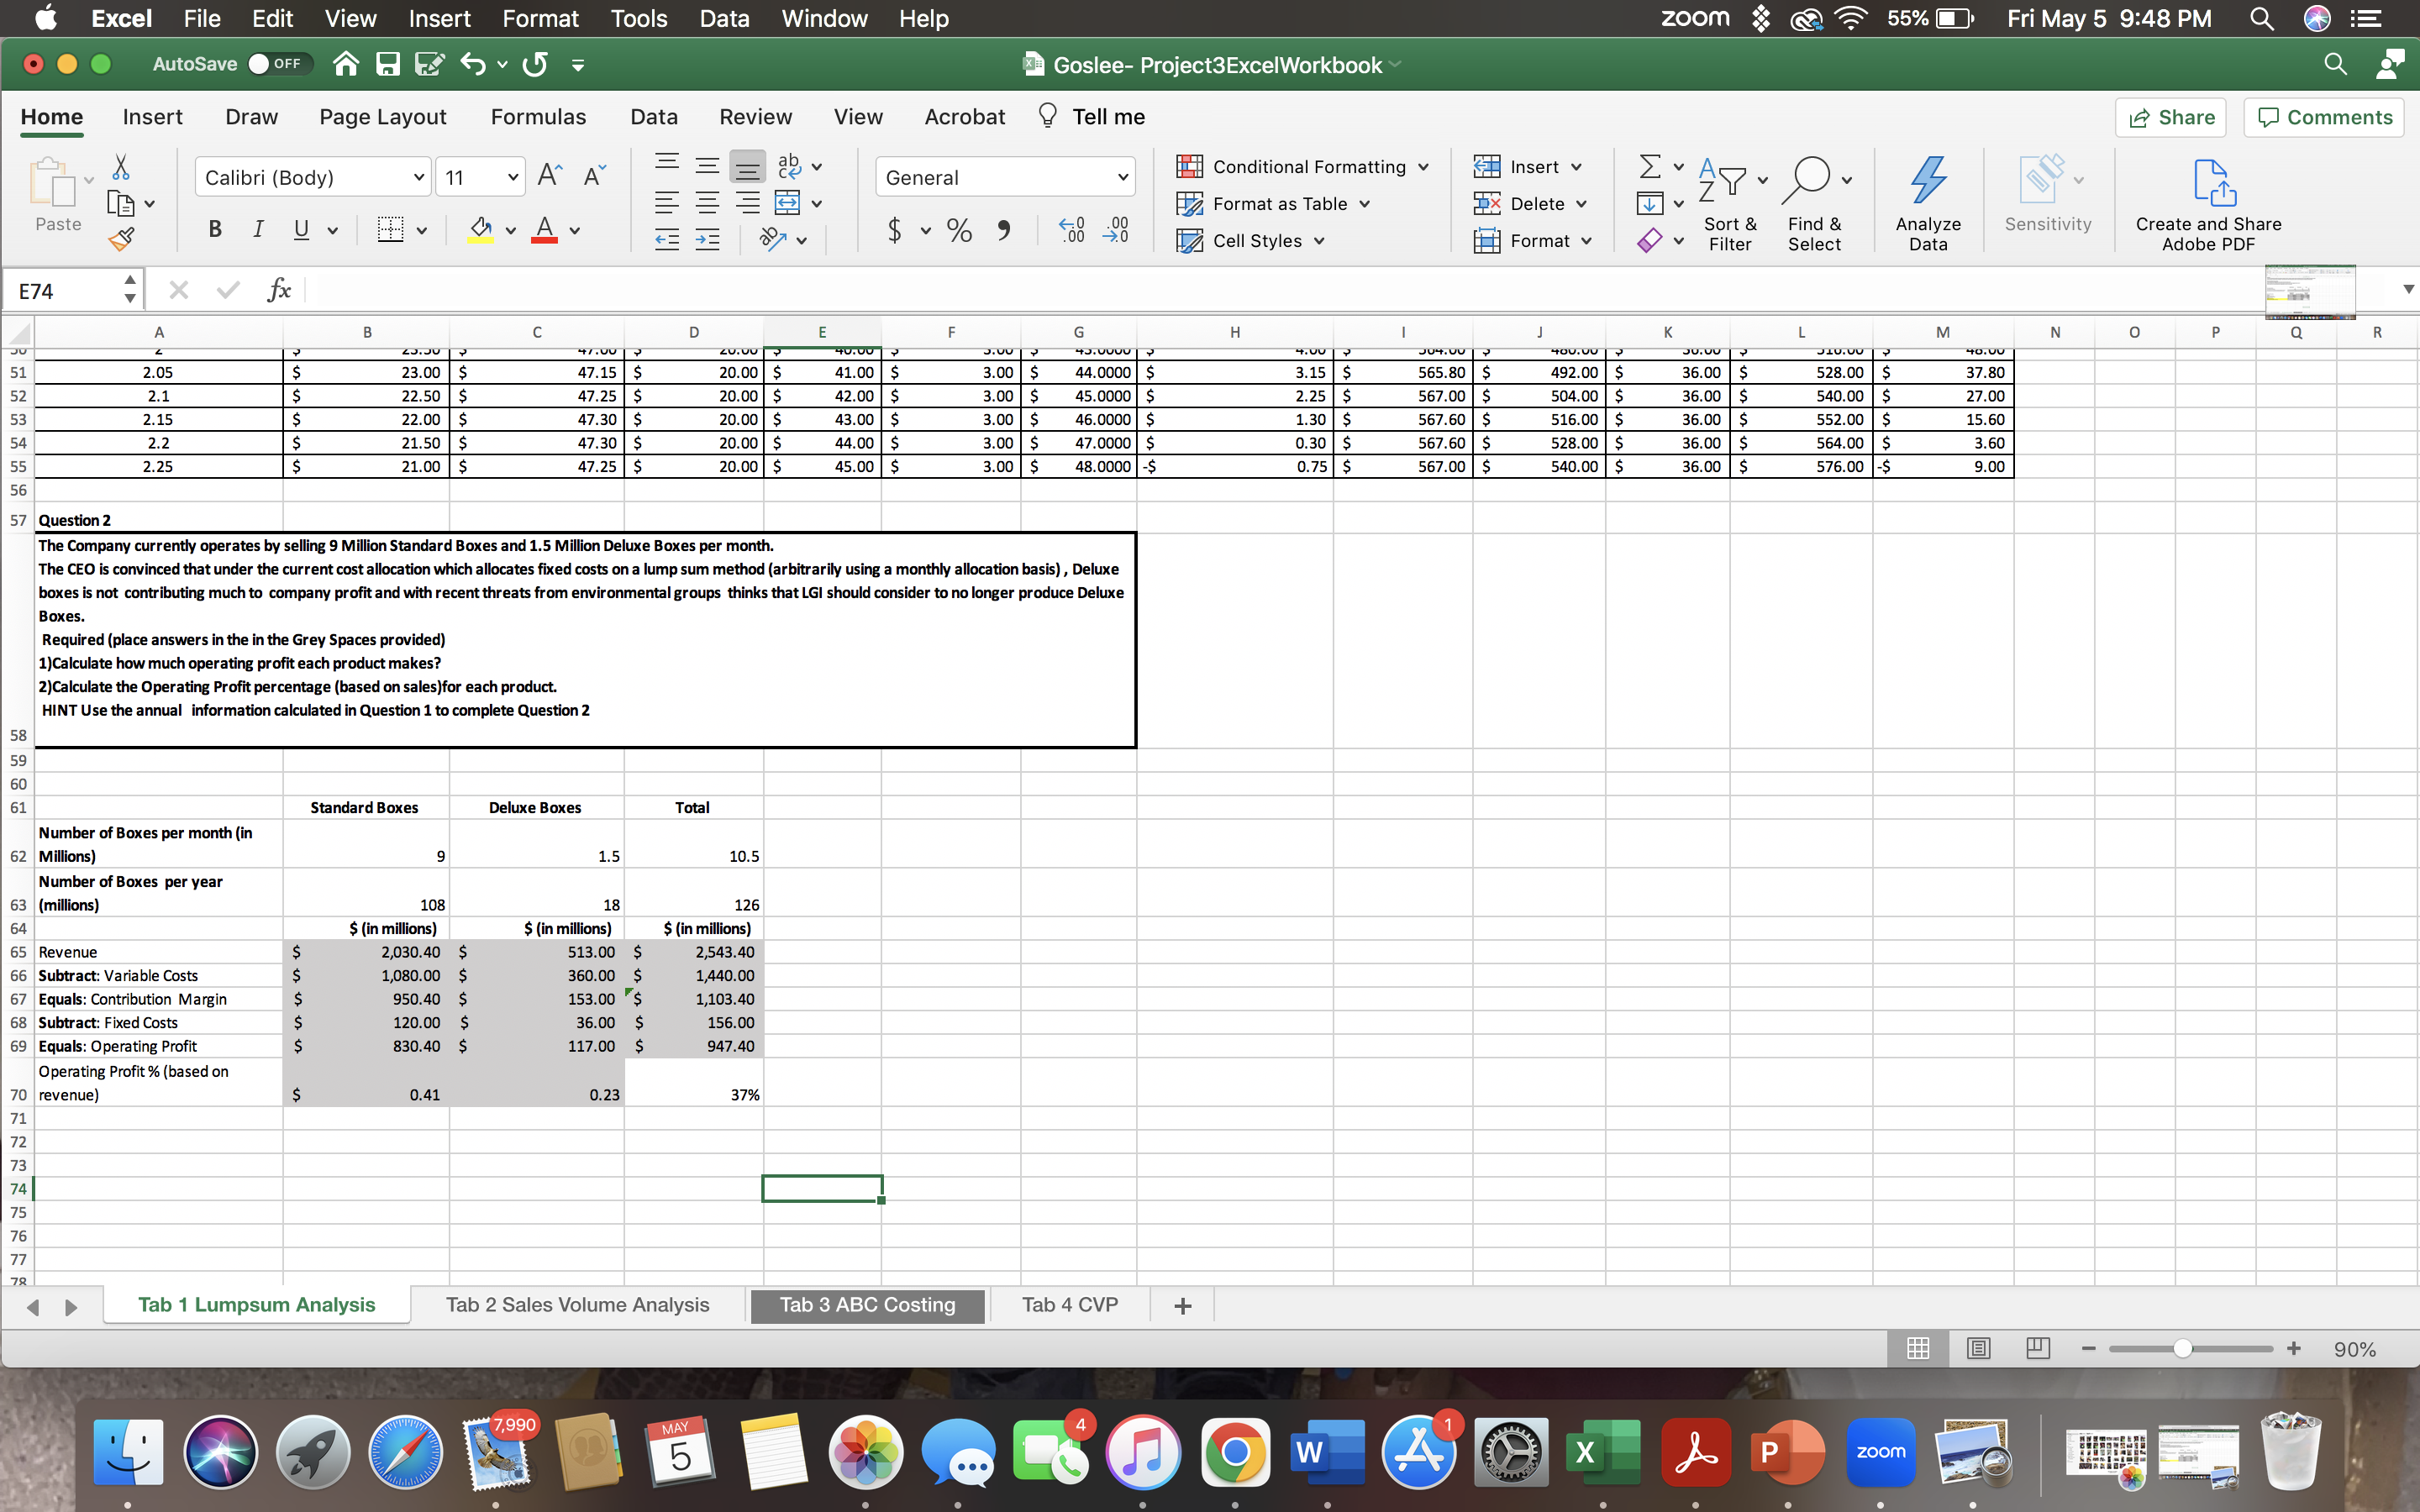
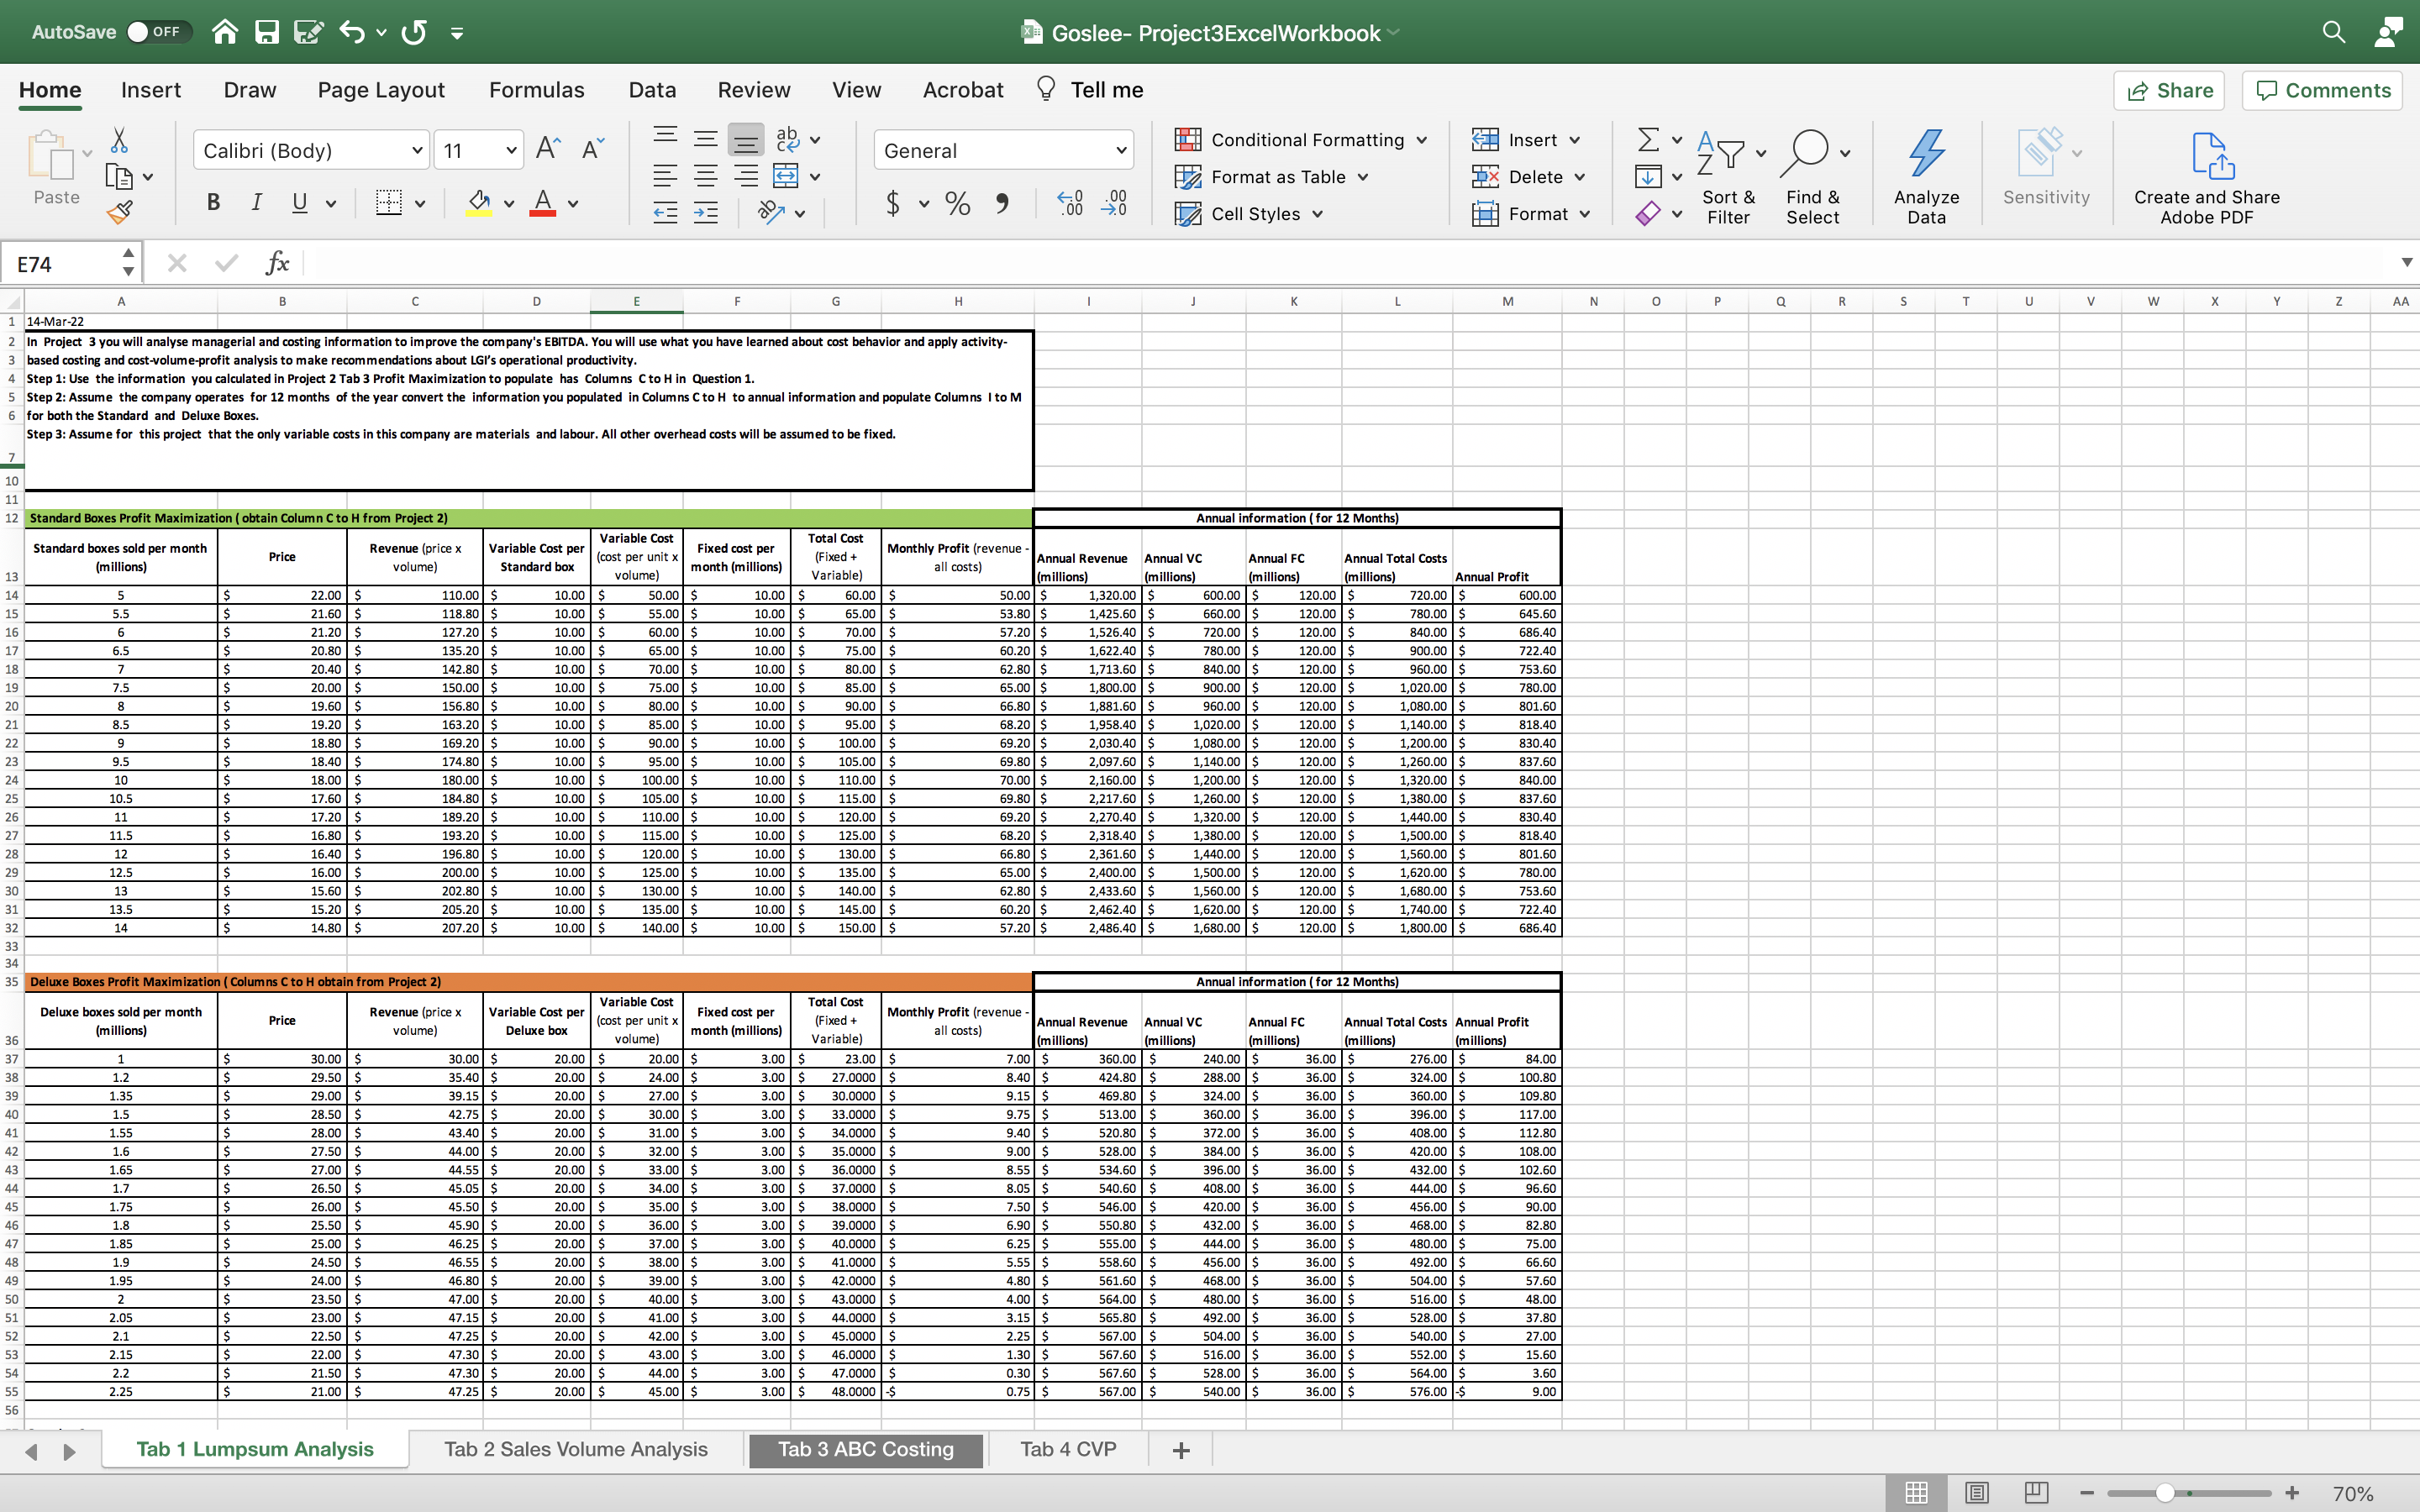
Excel File Edit View Insert Format Tools Data Window Help zoom57% Fri May 5 9:42 PM AutoSave OFF Goslee- Project3ExcelWorkbook Home Insert Draw Page Layout Formulas Data Review View Acrobat Tell me Share Comments Calibri (Body) v 11 V AA dev General Conditional Formatting v Insert v Ex AP- O. E Format as Table Ex Delete v Paste BIUV $ ~ % 9 Sort & Find & Analyze Sensitivity Create and Share Cell Styles v Format v Filter Select Data Adobe PDF D24 4 X V fx B C D E F G H K M N 0 Q R Question 1 A new intern thinks that the profit for Deluxe Boxes are higher than those calculated using the lump sum method (as in Tab1). The intern suggests calculating the profits using an allocation method for fixed costs based on sales volume( the number of boxes sold) to split the Fixed Costs between the Standard and Deluxe Boxes. Required: (Complete the grey spaces) 1) First calculate the percenatge portion each product has of the total sales voume 1) How much fixed costs are allocated to each product based on the sales volume method suggested by the intern? 2) Also calculate the new operating profit percentage (based on sales) for each product. N N Standard Boxes Deluxe Boxes Total 5 Volumes (per Month) 9 1.5 10.5 6 Volumes per year (Millions) BOT 18 126 7 Calculate the portion of Sales Volume (percentage sales volume) 8 Calculate how much fixed costs are allocated to each product. Standard Boxes Total Boxes($ 0 New Profit Calculation ($Millions) Deluxe Boxes ($Millions) Millions) 11 Revenue 2,030.40 513.00 |$ 2,543.40 12 Subtract Variable Costs ,080.00 $ 360.00 5 ,440.00 13 Equals: Contribution Margin 950.40 $ 153.00 $ 1,103.40 14 Subtract Fixed Costs 120.00 $ 36.00 5 156.00 15 Equals: Operating Profit 830.40 5 117.00 5 947.40 16 Operating Profit % (based on Revenue) 40.90% 22.81% 0.37 17 18 19 20 21 22 23 24 25 26 27 28 Tab 1 Lumpsum Analysis Tab 2 Sales Volume Analysis Tab 3 ABC Costing Tab 4 CVP + Select destination and press ENTER or choose Paste - + 100% 7,990 MAY 4 5 W A X P zoomExcel File Edit View Insert Format Tools Data Window Help zoom55%D Fri May 5 9:48 PM AutoSave OFF 3 Goslee- Project3ExcelWorkbook Home Insert Draw Page Layout Formulas Data Review View Acrobat Tell me Share Comments Calibri (Body) v 11 AA = General Conditional Formatting Insert v Format as Table v Ex Delete v Paste BIUV DVAv Find & 27 v $ ~ % " Sort & Analyze Cell Styles v Sensitivity Create and Share Format Filter Select Data Adobe PDF E74 + X V fx B C D E G H I M N O Q R 47.00 LU.OU 40.00 - Inonnick 400.00 40.00 2.05 23.00 $ 47.15 $ 20.00 $ 41.00 3.00 $ 44.0000 $ 3.15 $ 565.80 $ 492.00 $ 36.00 $ 528.00 $ 37.80 2.1 22.50 5 47.25 5 20.00 $ 42.00 $ 3.00 $ 45.0000 $ 2 .25 5 567.00 5 504 .00 $ 36.00 $ 540.00 $ 27.00 2.15 22.00 5 47.30 $ 20.00 $ 43.00 $ 3.00 $ 46.0000 S 1.30 $ 567.60 5 516.00 $ 36.00 $ 552.00 $ 15.60 2.2 21.50 $ 47.30 $ 20.00 $ 44.00 $ 3.00 $ 47.0000 $ 0.30 $ 567.60 5 528.00 $ 36.00 $ 564.00 5 3.60 2.25 21.00 5 47.25 5 20.00 $ 45.00 5 3.00 5 48.0000 -$ 0.75 5 567.00 5 540.00 5 36.00 5 576.00 -5 9.00 57 Question The Company currently operates by selling 9 Million Standard Boxes and 1.5 Million Deluxe Boxes per month. The CEO is convinced that under the current cost allocation which allocates fixed costs on a lump sum method (arbitrarily using a monthly allocation basis) , Deluxe boxes is not contributing much to company profit and with recent threats from environmental groups thinks that LGI should consider to no longer produce Deluxe Boxes Required (place answers in the in the Grey Spaces provided) 1)Calculate how much operating profit each product makes? 2)Calculate the Operating Profit percentage (based on sales) for each product. HINT Use the annual information calculated in Question 1 to complete Question 2 58 59 60 61 Standard Boxes Deluxe Boxes Total Number of Boxes per month (in 62 Millions) 9 1.5 10.5 Number of Boxes per year 63 (millions 108 18 126 64 $ (in millions) $ (in millions) $ (in millions) 65 Revenue 2,030.40 $ 513.00 $ ,543.40 6 Subtract: Variable Costs 1,080.00 360.00 $ 1,440.00 $7 Equals: Contribution Margin 950.40 153.00 S 1,103.40 68 Subtract: Fixed Cost 20.00 36.00 S 156.00 69 Equals: Operating Profit 830.40 117.00 947.40 Operating Profit % (based on 70 revenue) S 0.41 0.23 37% 71 72 73 74 75 76 77 Tab 1 Lumpsum Analysis Tab 2 Sales Volume Analysis Tab 3 ABC Costing Tab 4 CVP + - + 90% 7,990 MAY 5 W X P zoomAutoSave OFF Goslee- Project3ExcelWorkbook Home Insert Draw Page Layout Formulas Data Review View Acrobat Tell me Share Comments Calibri (Body) v 11 AA = General Conditional Formatting Insert v E Ex AY - O. Paste BIUV Format as Table 4 DVAv Ex Delete v $ ~ % " Cell Styles v Format Sort & Find & Analyze Sensitivity Create and Share Filter Select Data Adobe PDF F74 X v fx D 14-Mar-22 G M N 0 Q R U V w In Project 3 you will analyse managerial and costing information to improve the company's EBITDA. You will use what you have learned about cost behavior and apply activity- based costing and cost-volume-profit analysis to make recommendations about LGI's operational productivity. 4 Step 1: Use the information you calculated in Project 2 Tab 3 Profit Maximization to populate has Columns C to H in Question 1. 5 Step 2: Assume the company operates for 12 months of the year convert the information you populated in Columns C to H to annual information and populate Columns I to M 6 for both the Standard and Deluxe Boxes. Step 3: Assume for this project that the only variable costs in this company are materials and labour. All other overhead costs will be assumed to be fixed. Standard Boxes Profit Maximization ( obtain Column C to H from Project 2) Annual information ( for 12 Months) Standard boxes sold per month Revenue (price x Variable Cost per |Variable Cost Price Fixed cost per Total Cost (millions) volume) Standard box (cost per unit x (Fixed + Monthly Profit (revenue - volume) |month (millions) Variable) all costs) Annual Revenue Annual VC Annual FC Annual Total Costs [millions) 22.00 5.5 110.00 3 10.00 S (millions) (millions) (millions) 10.00 $ 60.00 S Annual Profit 21.60 118.80 $ 10.00 $ 50.00 $ 55.00 $ 1,320.00 $ 600.00 $ 120.00 $ 10.00 $ 600.00 21.20 5 65.00 $ 127.20 $ 10.00 $ 53.80 $ 1,425.60 $ 720.00 S 660.00 $ 60.00 $ 120.00 $ 10.00 $ 780.00 $ 645.60 20.80 70.00 $ 57.20 $ 135.20 $ 10.00 $ ,526.40 $ 720.00 $ 120.00 $ 65.00 5 340.00 $ 686.40 20.40 10.00 75.00 $ 142.80 $ 10.00 $ 70.00 $ 60.20 $ 1,622.40 5 80.00 $ 120.00 $ 10.00 80.00 $ 900.00 S 722.40 20.00 150.00 $ 62.80 $ 10.00 $ 1,713.60 $ 75.00 $ $40.00 $ 120.00 $ 960.00 $ 10.00 753.60 19.60 85.00 $ 55.00 5 156.80 $ 10.00 1,800.00 $ 00.00 $ 80.00 $ 120.00 $ ,020.00 $ 780.00 19.20 163.20 $ 90.00 $ 10.00 5 10.00 85.00 S 95.00 $ 66.80 $ 1,881.60 $ 10.00 $ 10.00 $ 68.20 5 960.00 $ 120.00 $ 169.20 $ 1,958.40 $ 1,080.00 $ 801.60 90.00 $ 1,020.00 $ 120.00 $ 18.40 $ 10.00 5 10.00|$ 100.00 $ 1,140.00 $ 818 .40 174.80 $ 69.20 $ 2,030.40 $ 1,080.00 $ 120.00 $ ,200.00 $ 830.40 18.00 95.00 $ 10.00 $ 105.00 $ 180.00 $ 10.00 $ 10.00 $ 69.80 5 2,097.60 $ 1,140.00 $ 100.00 $ 120.00 |$ 110.00 $ 1,260.00 $ 70.00 $ 837.60 17.60 184.80 5 10.00 $ 2,160.00 $ 1,200.00 $ 120.00 $ 105.00 1,320.00 $ 840.00 17.20 $ 189.20 $ 10.00 5 115.00 $ 69.80 5 110.00 10.00 $ 2,217.60 $ 1,260.00 $ 1,380.00 $ 837.60 16.80 $ 193.20 $ 120.00 $ 10.00 $ 69.20 5 2,270.40 $ 115.00 $ 10.00 $ 125.00 $ 120.00 $ 1,440.00 $ 830.40 196.80 $ 10.00 $ 68.20 5 1,320.00 $ 2,318.40 $ 120.00 $ 1,380.00 $ 120.00 $ 10.00 $ 130.00 $ 1,500.00 $ 818.40 16.00 $ 200.00 $ 10.00 5 2,361.60 $ 125.00 $ 1,440.00 $ 0.00 $ 66.80 5 120.00 $ 1,560.00 $ 135.00 $ 65.00 $ 2,400.00 $ 801.60 15.60 202.80 $ 10.00 $ 1,500.00 $ 120.00 $ 130.00 10.00 $ 1,620.00 $ 780.00 15.20 205.20 5 10.00 5 140.00 $ 135.00 $ 62.80 $ 2,433.60 $ 1,560.00 $ 120.00 $ ,680.00 $ 753.60 14.80 5 10.00 $ 145.00 $ 207.20 $ 60.20 5 10.00 $ 140.00 2,462.40 $ 1,620.00 $ 0.00 $ 150.00 5 57.20 5 120.00 $ 1,740.00 $ 2,486.40 5 722.40 1,680.00 $ 120.00 $ 1,800.00 $ 686.40 Deluxe Boxes Profit Maximization ( Columns C to H obtain from Project 2) Variable Cost Annual information ( for 12 Months) Deluxe boxes sold per month Price Revenue (price x Total Cost (millions) Variable Cost per Fixed cost per Monthly Profit (revenue - volume) Deluxe box (cost per unit x volume) month (millions (Fixed + all costs) Annual Revenue Annual VC Variable) Annual FC Annual Total Costs Annual Profit 30.00 30.00 20.00 $ 20.00 [millions) (millions) (millions) (millions) 3.00 $ 23.00 (millions) 29.50 $ .00 $ 35.40 $ 20.00 $ 360.00 $ 240.00 $ 24.00 $ 3.00 $ 27.0000 $ 276.00 $ 29.00 8.40 $ 36.00 $ 84.00 39.15 $ 424.80 $ 20.00 $ 288.00 $ 6.00 $ 324.00 $ 100.80 28.50 27.00 3.00 $ 30.0000 $ 42.75 $ 20.00 $ 9.15 $ 30.00 169.80 $ 24.00 $ 36.00 8 $60.00 $ 109.80 28.00 43.40 5 33.0000 $ 9.75 $ 13.00 20.00 $ 31.00 $ 3.00 $ 60.00 $ 36.00 $ 117.00 27.50 44.00 $ 34.0000 $ $96.00 $ 20.00 $ 9.40 5 32.00 $ 520.80 $ 372.00 $ 3.00 $ 35.0000 $ 36.00 $ 112.80 27.00 44.55 $ 9.00 5 408.00 $ 20.00 $ 33.00 5 $28.00 5 3.00 $ 84.00 $ 36.00 $ 420.00 $ 108.00 26.50 45.05 $ 36.0000 $ 20.00 $ 8.55 $ 34.00 $ 534.60 5 96.00 $ .00 $ 26.00 45.50 $ 37.0000 $ 36.00 5 132.00 $ 20.00 5 8.05 5 540.60 $ 02.60 108.00 $ 35.00 S 3.00 S 96.60 38.0000 $ 7.50 36.00 $ 25.50 20.00 S 546.00 $ 144.00 $ 45.90 5 20.00 $ 36.00 3.00 $ 90.00 25.00 5 46.25 $ 39.0000 $ 456.00 $ 20.00 5 37.00 $ 6.90 5 550.80 $ 3.00 $ 40.0000 $ 32.00 $ 36.00 S 468.00 S 82.80 24.50 5 46.55 5 20.00 S 6.25 5 555.00 5 38.00 $ 444.00 $ 36.00 $ 3.00 $ 41.0000 $ 180.00 $ 75.00 24.00 46.80 $ 20.00 5 5.55 $ 558.60 5 456.00 $ 36.00 $ 492.00 $ 23.50 47.00 $ 39.00 $ 66.60 20.00 S 3.00 $ 42.0000 $ 3.00 5 4.80 5 561.60 468.00 $ 40.00 36.00 S 43.0000 $ 4.00 S $64.00 $ 504.00 $ 57.60 23.00 47.15 $ 20.00 $ 180.00 $ 41.00 $ 36.00 $ 3.00 $ 44.0000 $ 516.00 $ 48.00 22.50 20.00 3.15 5 565.80 $ 42.00 36.00 $ 528.00 $ 37.80 22.00 47.25 5 192.00 $ 47.30 $ 20.00 5 43.00 $ 3.00 $ 45.0000 $ 3.00 $ 46.0000 $ 567.00 $ 1.30 5 504.00 $ 36.00 $ 540.00 $ 21.50 47.30 5 567.60 $ 27.00 516.00 $ 36.00 $ 552.00 $ 15.60 21.00 20.00 $ 47.25 5 20.00 44.00 $ 15.00 3.00 $ 47.0000 $ 3.00 48.0000 -$ 0.30 5 $67.60 5 528.00 $ 36.00 $ $67.00 5 564.00 5 540.00 $ 3.60 D Tab 1 Lumpsum Analysis Tab 2 Sales Volume Analysis Tab 3 ABC Costing Tab 4 CVP + + 70%
Step by Step Solution
There are 3 Steps involved in it
1 Expert Approved Answer
Step: 1 Unlock
Question Has Been Solved by an Expert!
Get step-by-step solutions from verified subject matter experts
Step: 2 Unlock
Step: 3 Unlock
Students Have Also Explored These Related Finance Questions!