Question: Excel File Edit View Insert Format Tools Data Window Help Q 8 Sun Jul 16 7:02 PM plus.pearson.com o. . AutoSave O OFF ~ A
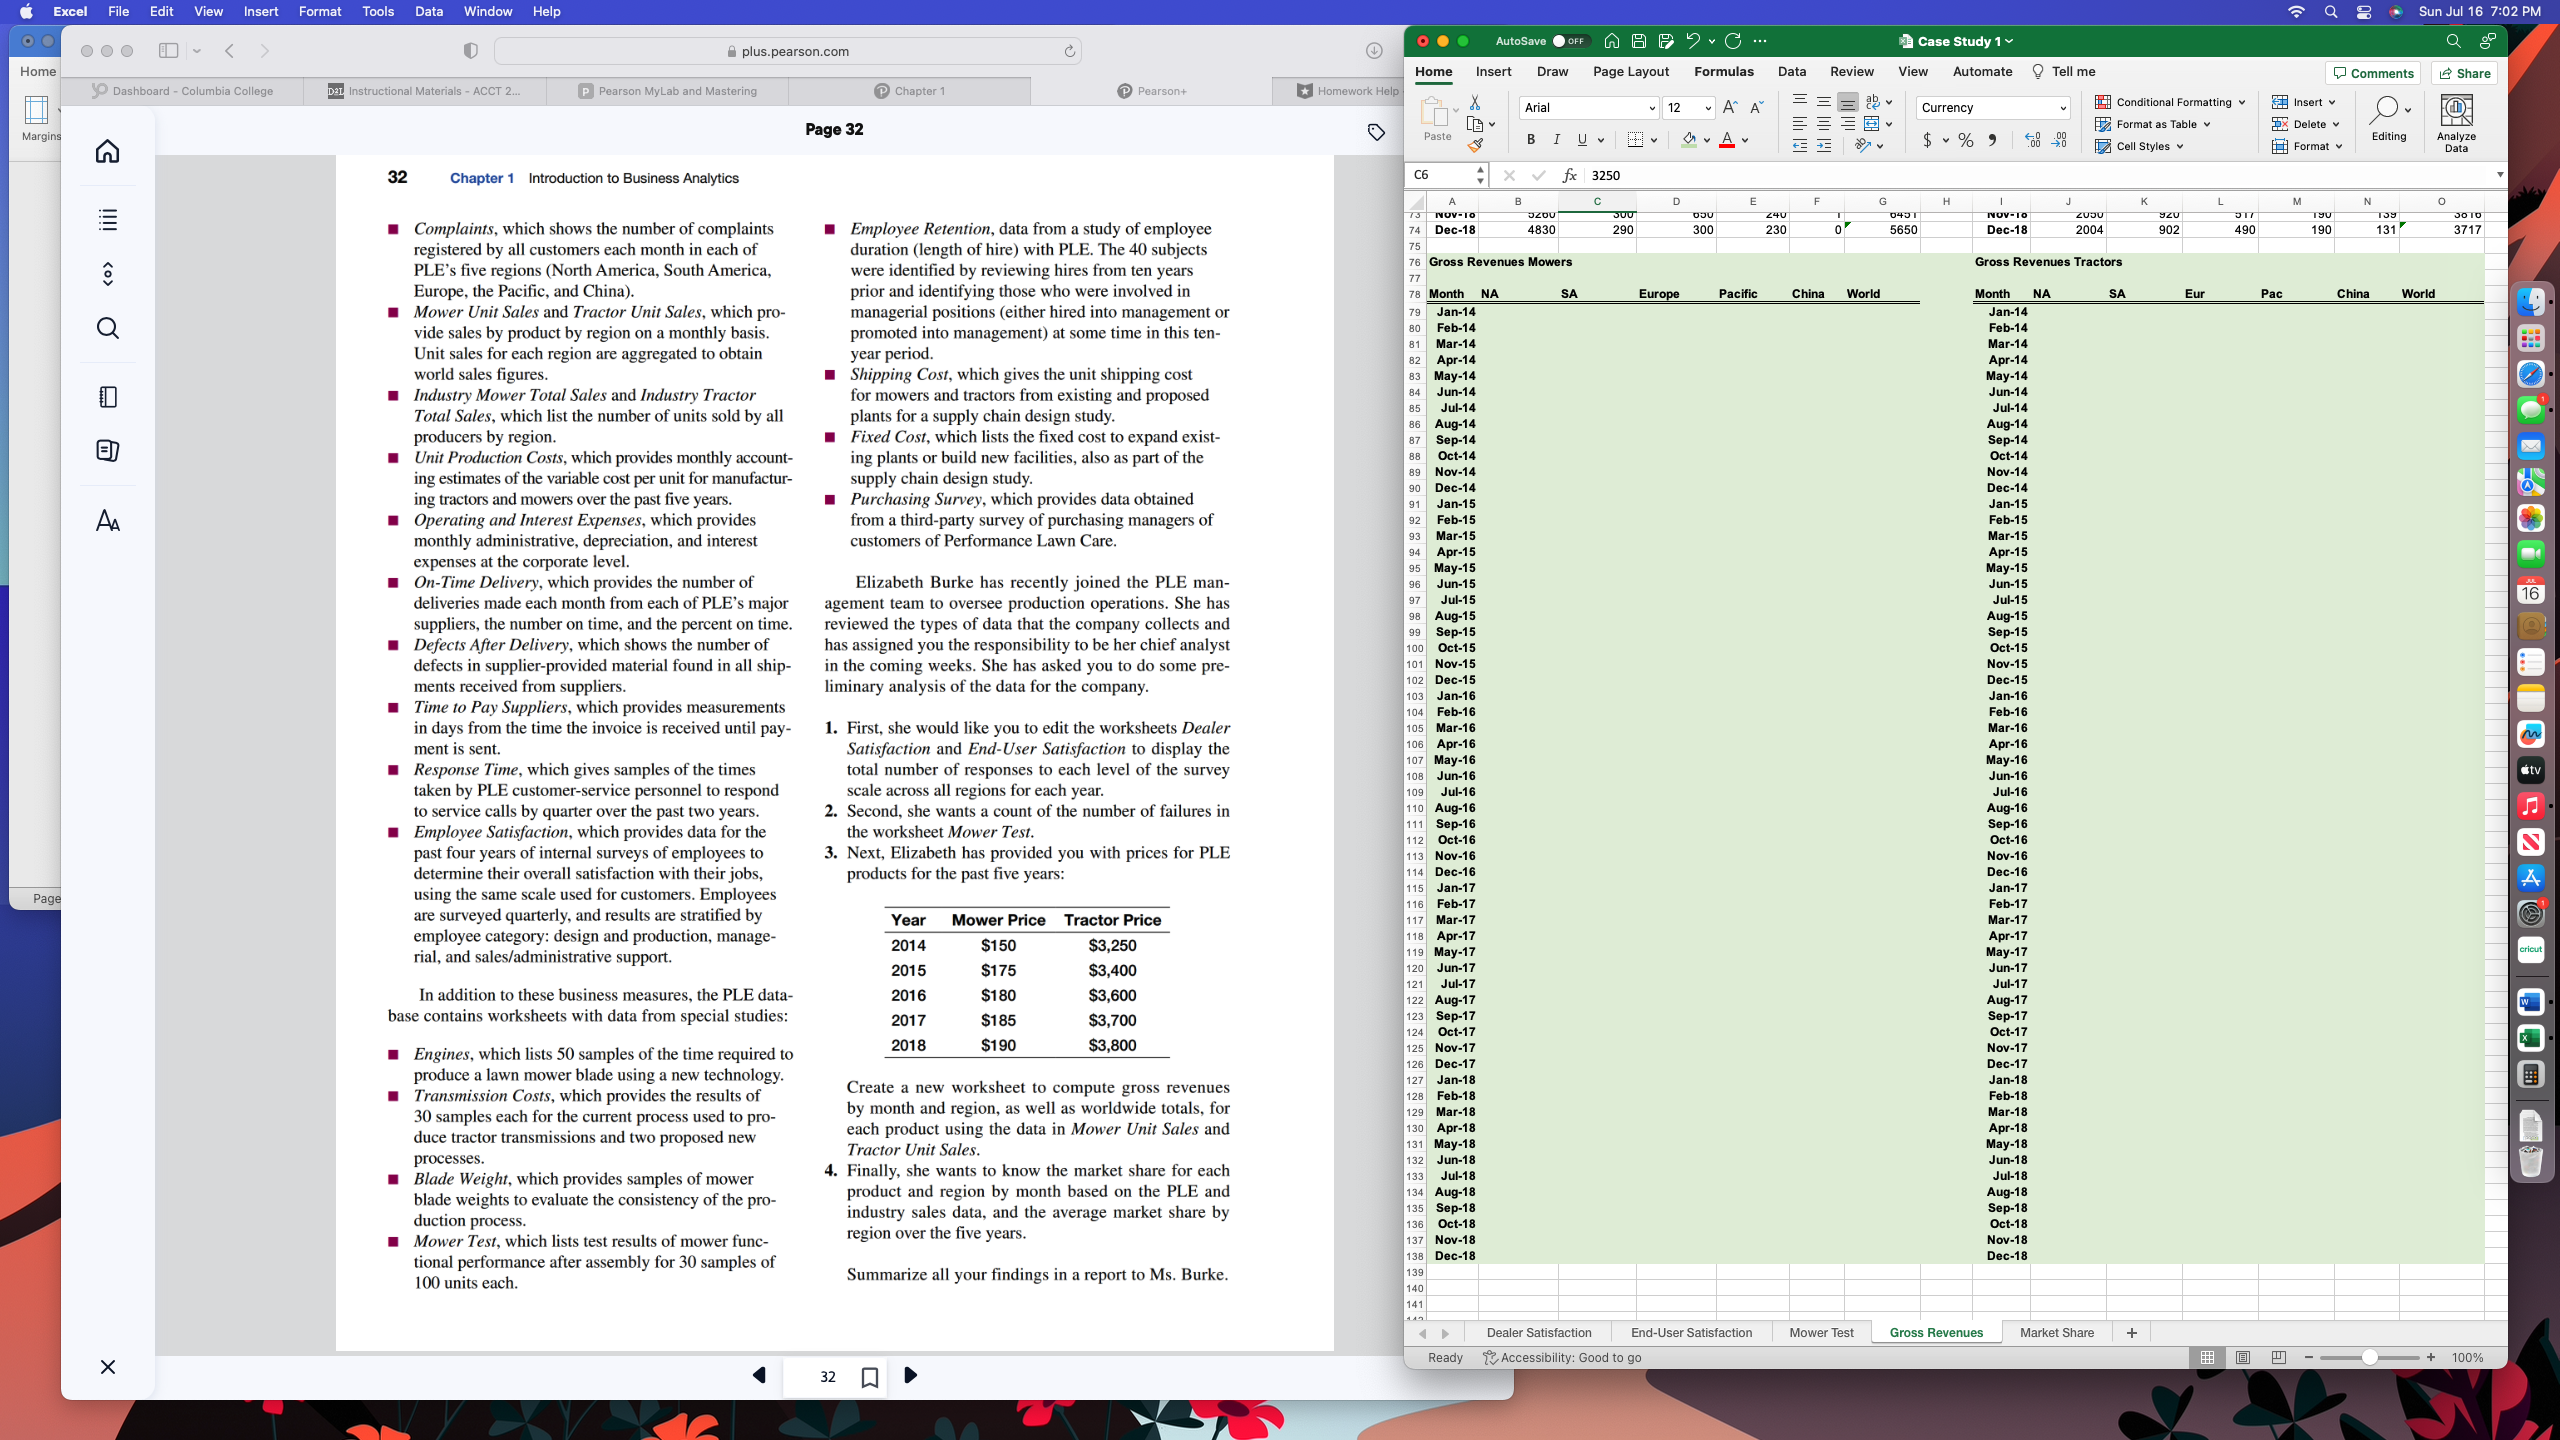
Excel File Edit View Insert Format Tools Data Window Help Q 8 Sun Jul 16 7:02 PM plus.pearson.com o. . AutoSave O OFF ~ A 9 ? . C ... Case Study 1 ~ Home Home Insert Draw Page Layout Formulas Data Review View Automate 9 Tell me Comments Share Dashboard - Columbia College DZI Instructional Materials - ACCT 2... P Pearson MyLab and Mastering Chapter 1 Pearson+ *Homework Help Arial 12 ~ A A =E Currency iConditional Formatting Insert v Margins Page 32 Paste Format as Table v Delete O BIU FLAV $ ~ % 9 08 28 Cell Styles Editing Format v Analyze Data 32 Chapter 1 Introduction to Business Analytics C6 X V fx 3250 E Complaints, which shows the number of complaints NOV-T co 240 NOV-TO ZUJU JO TO Employee Retention, data from a study of employee 74 D Dec-1 4830 290 300 230 565 200 90 490 190 3717 registered by all customers each month in each of duration (length of hire) with PLE. The 40 subjects 75 Dec-18 PLE's five regions (North America, South America, were identified by reviewing hires from ten years 6 Gross Revenues Mowers Gross Revenues Tractors 7 Europe, the Pacific, and China). prior and identifying those who were involved in 78 Month NA SA Europe Pacific China World Month NA SA Eur Pac China Mower Unit Sales and Tractor Unit Sales, which pro- managerial positions (either hired into management or Jan-14 Q vide sales by product by region on a monthly basis. promoted into management) at some time in this ten- Feb-14 Jan-14 Feb-1 Unit sales for each region are aggregated to obtain year period. 81 Mar-14 Mar-14 Apr-14 Apr-14 world sales figures. Shipping Cost, which gives the unit shipping cost May-14 May-14 Industry Mower Total Sales and Industry Tractor for mowers and tractors from existing and proposed Jun-14 Jun-14 Total Sales, which list the number of units sold by all plants for a supply chain design study 85 Jul- 14 Jul-14 86 Aug- 14 Aug-14 producers by region. Fixed Cost, which lists the fixed cost to expand exist- Sep- 14 Sep-14 Unit Production Costs, which provides monthly account- ing plants or build new facilities, also as part of the Oct-14 ing estimates of the variable cost per unit for manufacture supply chain design study. Nov-14 Nov-14 ing tractors and mowers over the past five years. Purchasing Survey, which provides data obtained 90 D 1 Jan-15 Dec-14 AA Operating and Interest Expenses, which provides from a third-party survey of purchasing managers of Feb- 15 monthly administrative, depreciation, and interest customers of Performance Lawn Care. Mar-15 Mar-15 expenses at the corporate level. Apr-1: Apr-15 95 May - 15 May-15 On-Time Delivery, which provides the number of Elizabeth Burke has recently joined the PLE man- 96 J Jun-15 deliveries made each month from each of PLE's major agement team to oversee production operations. She has 97 Jul - 15 Jul-15 suppliers, the number on time, and the percent on time. reviewed the types of data that the company collects and Aug - 15 Sep - 15 Aug-15 ep-15 Defects After Delivery, which shows the number of has assigned you the responsibility to be her chief analyst 100 0 Oct- 15 defects in supplier-provided material found in all ship- in the coming weeks. She has asked you to do some pre- 102 Dec - 15 Nov-15 ments received from suppliers. liminary analysis of the data for the company Dec-15 Time to Pay Suppliers, which provides measurements 103 Jan - 16 Jan - 16 104 Feb- 16 Feb- 16 in days from the time the invoice is received until pay- 1. First, she would like you to edit the worksheets Dealer 105 Mar-16 Mar - 16 ment is sent. Satisfaction and End-User Satisfaction to display the 106 Apr-16 Apr-16 Response Time, which gives samples of the times total number of responses to each level of the survey 107 May-16 May-16 taken by PLE customer-service personnel to respond Jun-16 Jun- 16 scale across all regions for each year. 109 Jul-16 Jul-16 to service calls by quarter over the past two years. 2. Second, she wants a count of the number of failures in 110 Aug-16 Aug-16 Employee Satisfaction, which provides data for the the worksheet Mower Test. 111 Sep - 16 Sep-16 112 Oct - 16 Oct - 16 past four years of internal surveys of employees to 3. Next, Elizabeth has provided you with prices for PLE 113 Nov- 16 Nov - 16 determine their overall satisfaction with their jobs, products for the past five years: 114 Dec-16 ec-16 using the same scale used for customers. Employees 115 Jan-17 Jan- 17 are surveyed quarterly, and results are stratified by 116 Feb-17 ieb- 17 Year Mower Price Tractor Price 117 Mar- 17 Mar-17 employee category: design and production, manage- 2014 $150 $3,250 18 Apr- 17 Apr-17 rial, and sales/administrative support. 19 May-17 May-17 1015 $175 $3,400 120 Jun-17 Jun-17 In addition to these business measures, the PLE data- 121 Jul-17 Jul-17 2016 $180 $3,60 122 Aug-17 Aug-17 base contains worksheets with data from special studies: 2017 $185 $3,700 123 Sep-17 124 Oct-17 Sep-17 Det-17 Engines, which lists 50 samples of the time required to 2018 $190 $3,800 125 Nov-17 Nov-17 produce a lawn mower blade using a new technology. 126 Dec-17 Dec-17 Create a new worksheet to compute gross revenues 127 Jan - 18 Jan-18 Transmission Costs, which provides the results of 30 samples each for the current process used to pro- by month and region, as well as worldwide totals, for 128 Feb- 18 Feb- 18 129 Mar - 18 Mar-18 duce tractor transmissions and two proposed new each product using the data in Mower Unit Sales and 130 Apr-18 Apr-18 131 May-18 May-18 processes. Tractor Unit Sales. 4. Finally, she wants to know the market share for each 132 Jun-18 Jun-18 Blade Weight, which provides samples of mower 133 Jul- 18 Jul- 18 blade weights to evaluate the consistency of the pro- product and region by month based on the PLE and 134 Aug-18 Aug-18 duction process. industry sales data, and the average market share by 135 Sep - 18 Sep-18 Oct- 18 Mower Test, which lists test results of mower func- region over the five years. 137 Nov-18 Nov-18 ional performance after assembly for 30 samples of 138 Dec-18 ec-18 100 units each Summarize all your findings in a report to Ms. Burke. 139 140 141 wal Dealer Satisfaction End-User Satisfaction Mower Test Gross Revenues Market Share + X Ready Accessibility: Good to go 1 0 - - 0 + 100% 32 D
Step by Step Solution
There are 3 Steps involved in it
1 Expert Approved Answer
Step: 1 Unlock
Question Has Been Solved by an Expert!
Get step-by-step solutions from verified subject matter experts
Step: 2 Unlock
Step: 3 Unlock
Students Have Also Explored These Related General Management Questions!