

Question: Starting with an investment in 2009 , what would have been the return over the subsequent 5 years? Assume you reinvest all dividends at the
- Starting with an investment in 2009 , what would have been the return over the subsequent 5 years? Assume you reinvest all dividends at the end of each year.
- What is the annualized HPR for the 5-year investment starting after 2008?
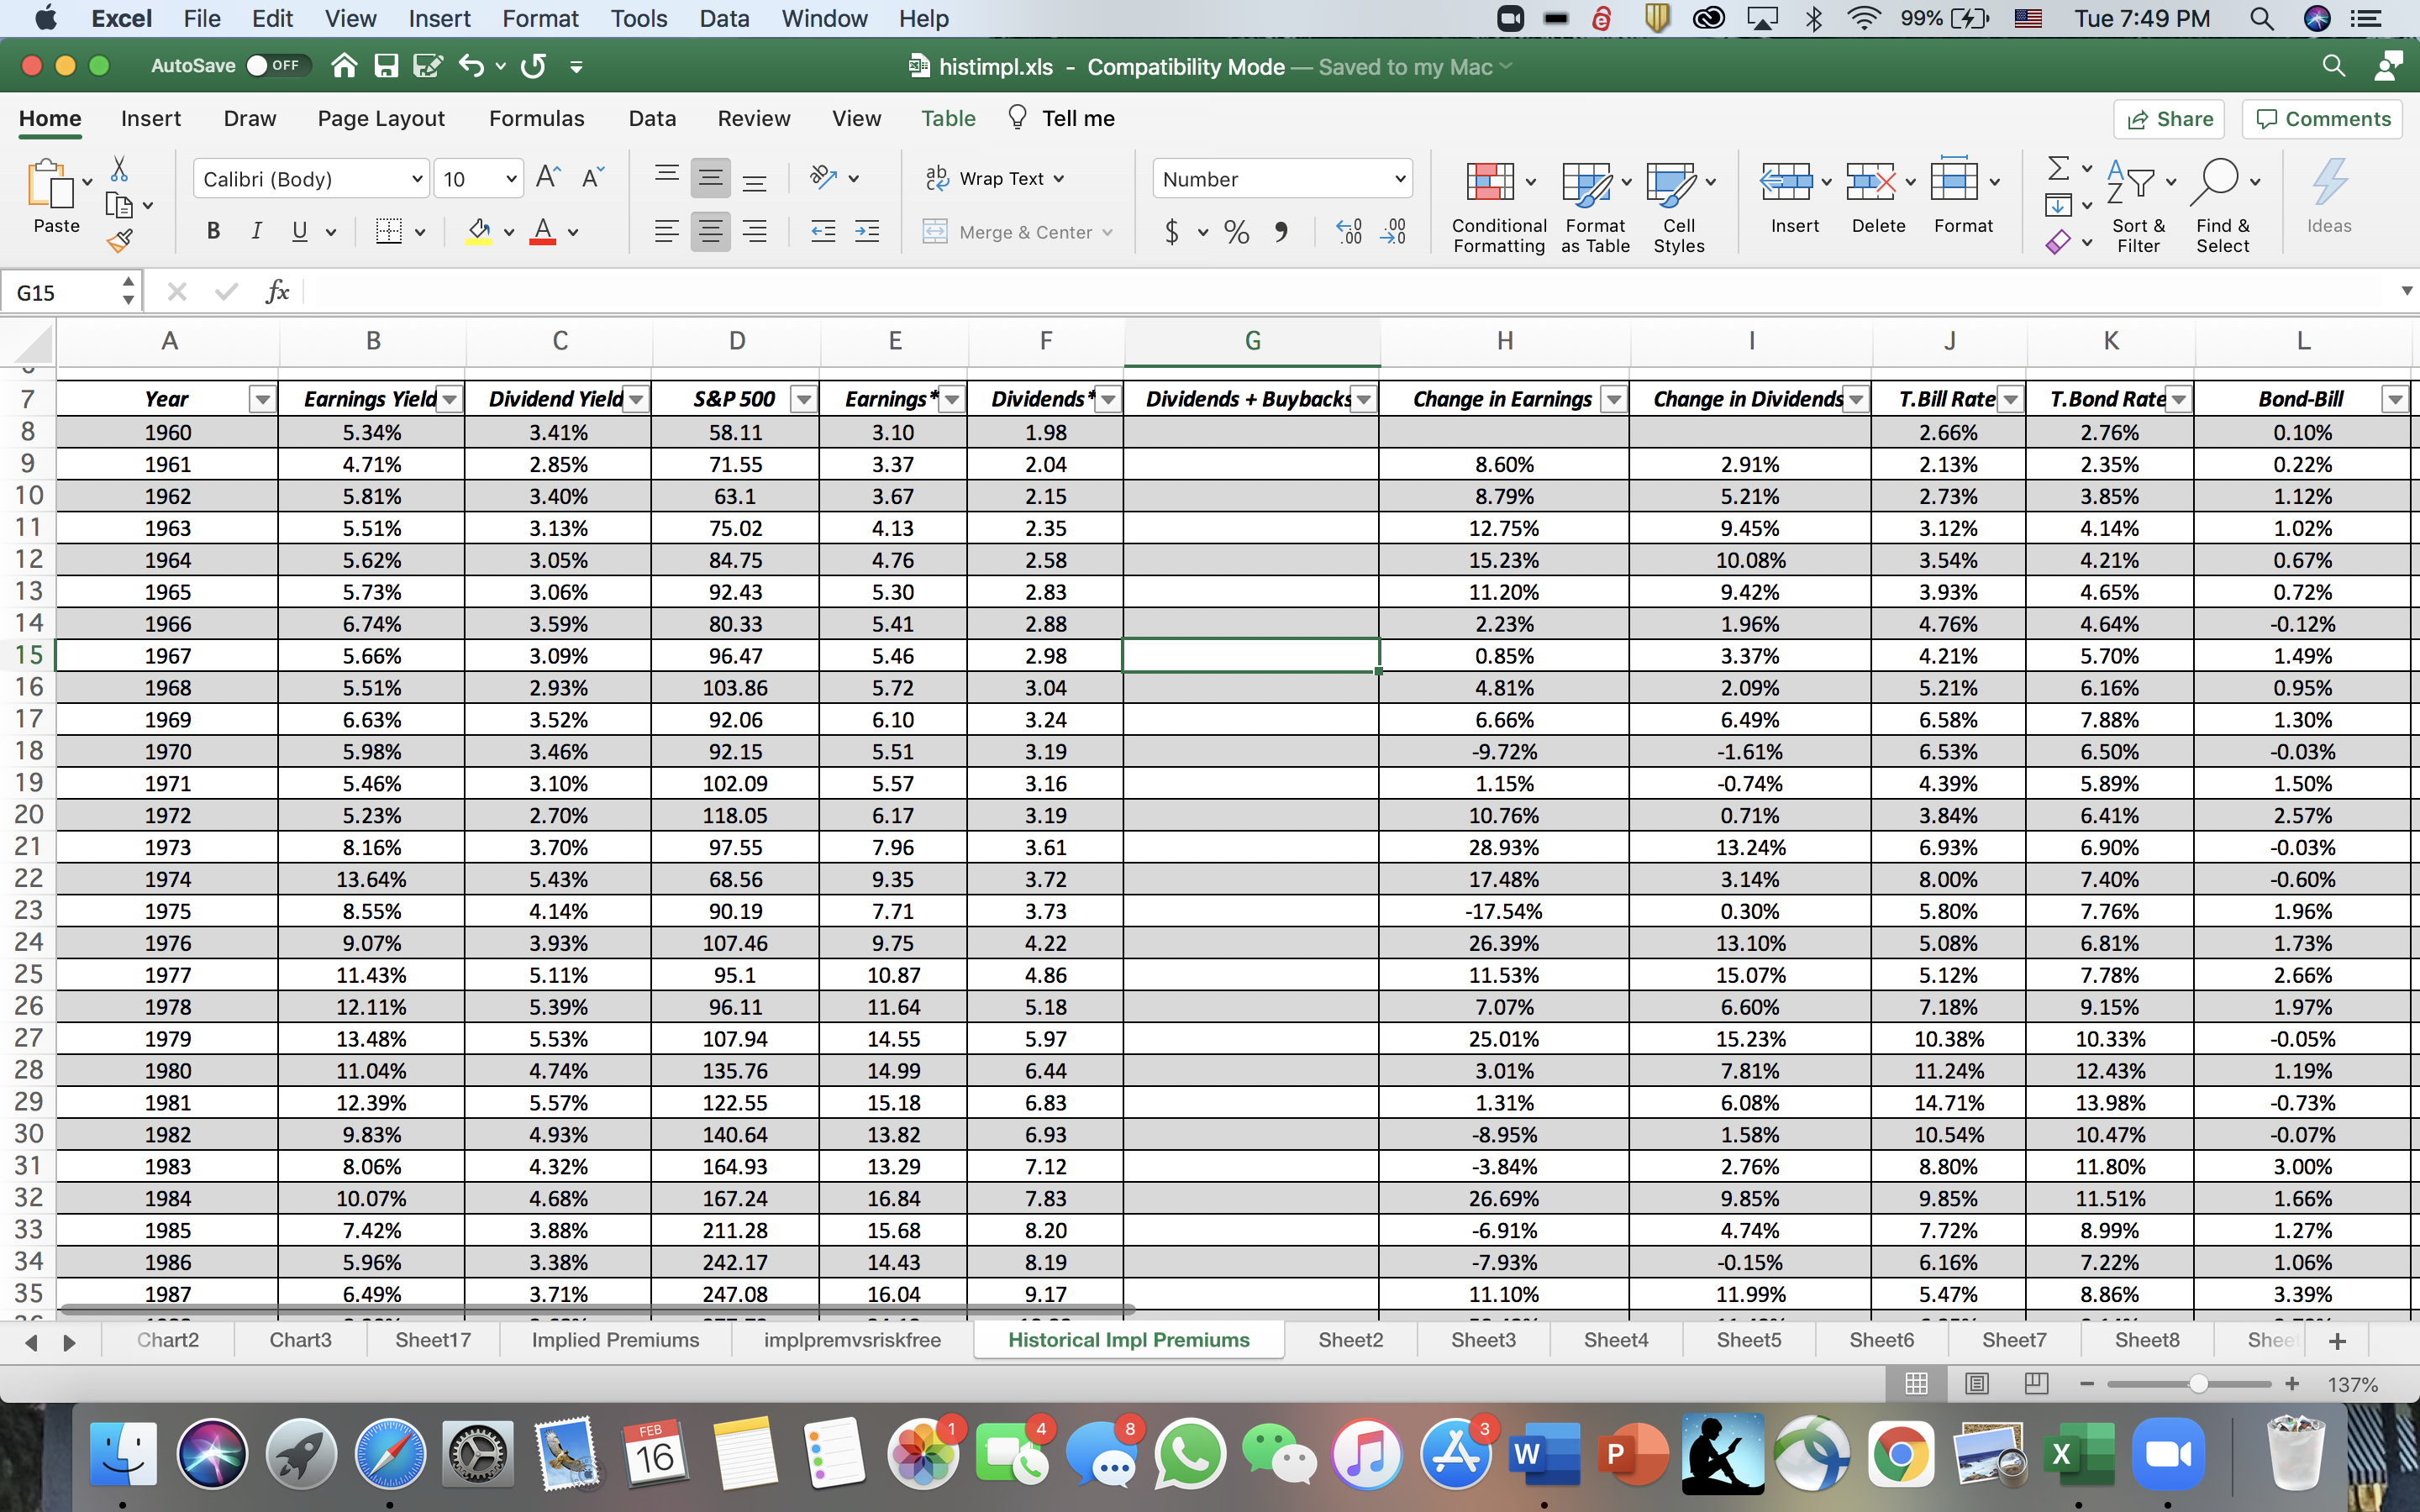
Excel File Edit View Insert Format Tools Data Window Help 8 Home Insert Draw Page Layout Paste G15 7898I2345 10 11 12 13 14 15 16 17 18 19 20 21 22 23 24 25 26 27 28 29 30 31 32 33 34 35 AutoSave OFF A Year 1960 1961 1962 1963 1964 1965 1966 1967 1968 1969 1970 1971 1972 1973 1974 1975 1976 1977 1978 1979 1980 1981 1982 1983 1984 1985 1986 1987 Chart2 Calibri (Body) BI fx V B Chart3 V 10 V Earnings Yield 5.34% 4.71% 5.81% 5.51% 5.62% 5.73% 6.74% 5.66% 5.51% 6.63% 5.98% 5.46% 5.23% 8.16% 13.64% 8.55% 9.07% 11.43% 12.11% 13.48% 11.04% 12.39% 9.83% 8.06% 10.07% 7.42% 5.96% 6.49% Sheet17 W Formulas Data V V A^ A A V C Dividend Yield 3.41% 2.85% 3.40% 3.13% 3.05% 3.06% 3.59% 3.09% 2.93% 3.52% 3.46% 3.10% 2.70% 3.70% 5.43% 4.14% 3.93% 5.11% 5.39% 5.53% 4.74% 5.57% 4.93% 4.32% 4.68% 3.88% 3.38% 3.71% Implied Premiums FEB 16 Review View D S&P 500 58.11 71.55 63.1 75.02 84.75 92.43 80.33 96.47 103.86 92.06 92.15 102.09 118.05 97.55 68.56 90.19 107.46 95.1 96.11 107.94 135.76 122.55 140.64 164.93 167.24 211.28 242.17 247.08 E histimpl.xls - Compatibility Mode - Saved to my Mac Table Earnings 3.10 3.37 3.67 4.13 4.76 5.30 5.41 5.46 5.72 6.10 5.51 5.57 6.17 7.96 9.35 7.71 9.75 10.87 11.64 14.55 14.99 15.18 13.82 13.29 16.84 15.68 14.43 16.04 ab Wrap Text implpremvsriskfree Tell me 1 Merge & Center v F 8 Number $ % V G Dividends* 1.98 2.04 2.15 2.35 2.58 2.83 2.88 2.98 3.04 3.24 3.19 3.16 3.19 3.61 3.72 3.73 4.22 4.86 5.18 5.97 6.44 6.83 6.93 7.12 7.83 8.20 8.19 9.17 Historical Impl Premiums 5.000 Dividends + Buybacks .00 .0 Sheet2 Conditional Format Formatting as Table Change in Earnings 8.60% 8.79% 12.75% 15.23% 11.20% 2.23% 0.85% 4.81% 6.66% -9.72% 1.15% 10.76% 28.93% 17.48% -17.54% 26.39% 11.53% 7.07% 25.01% 3.01% 1.31% -8.95% -3.84% 26.69% -6.91% -7.93% 11.10% Sheet3 3 M A W Sheet4 P Cell Styles 1 V Insert Delete Change in Dividends 2.91% 5.21% 9.45% 10.08% 9.42% 1.96% 3.37% 2.09% 6.49% -1.61% -0.74% 0.71% 13.24% 3.14% 0.30% 13.10% 15.07% 6.60% 15.23% 7.81% 6.08% 1.58% 2.76% 9.85% 4.74% -0.15% 11.99% Sheet5 99% [4] Format T.Bill Rate 2.66% 2.13% Sheet6 O J 2.73% 3.12% 3.54% 3.93% 4.76% 4.21% 5.21% 6.58% 6.53% 4.39% 3.84% 6.93% 8.00% 5.80% 5.08% 5.12% 7.18% 10.38% 11.24% 14.71% 10.54% 8.80% 9.85% 7.72% 6.16% 5.47% Sheet7 B Tue 7:49 PM X Share 180. Sort & Find & Filter Select K T.Bond Rate 2.76% 2.35% 3.85% 4.14% 4.21% 4.65% 4.64% 5.70% 6.16% 7.88% 6.50% 5.89% 6.41% 6.90% 7.40% 7.76% 6.81% 7.78% 9.15% 10.33% 12.43% 13.98% 10.47% 11.80% 11.51% 8.99% 7.22% 8.86% Sheet8 Comments L 4 Ideas Bond-Bill 0.10% 0.22% 1.12% 1.02% 0.67% 0.72% -0.12% 1.49% 0.95% 1.30% -0.03% 1.50% 2.57% -0.03% -0.60% 1.96% 1.73% 2.66% 1.97% -0.05% 1.19% -0.73% -0.07% 3.00% 1.66% 1.27% 1.06% 3.39% Sheet + + 137%
Step by Step Solution
3.31 Rating (148 Votes )
There are 3 Steps involved in it
To calculate the return over the subsequent 5 years starting with an investment in 2009 we need to consider the annual returns and reinvestment of dividends Heres how you can do it Initial Investment ... View full answer

Get step-by-step solutions from verified subject matter experts