

Question: Excel file has been uploaded as an image (there are two images for it). This is a problem about Montecarlo simulation using Excel. f. [4
Excel file has been uploaded as an image (there are two images for it). This is a problem about Montecarlo simulation using Excel.
![[4 points] The final endowment can also be enlarged by increasing the](https://dsd5zvtm8ll6.cloudfront.net/si.experts.images/questions/2025/02/67a87e6ad4de1_65867a87e6ac383d.jpg)
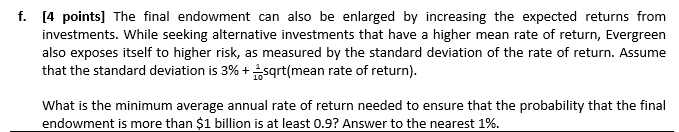
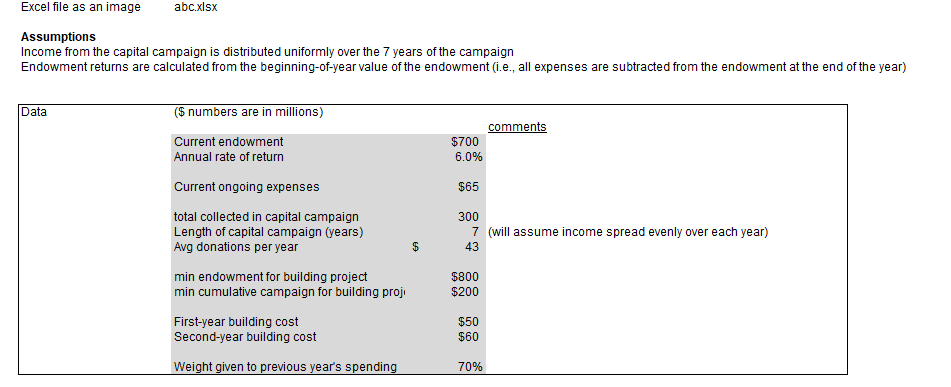
f. [4 points] The final endowment can also be enlarged by increasing the expected returns from investments. While seeking alternative investments that have a higher mean rate of return, Evergreen also exposes itself to higher risk, as measured by the standard deviation of the rate of return. Assume that the standard deviation is 3% + _ sqrt(mean rate of return). What is the minimum average annual rate of return needed to ensure that the probability that the final endowment is more than $1 billion is at least 0.9? Answer to the nearest 1%.Excel file as an image abc.xisx Assumptions Income from the capital campaign is distributed uniformly over the 7 years of the campaign Endowment returns are calculated from the beginning-of-year value of the endowment (i.e., all expenses are subtracted from the endowment at the end of the year) Data ($ numbers are in millions) comments Current endowment $700 Annual rate of return 6.0% Current ongoing expenses $65 total collected in capital campaign 300 Length of capital campaign (years) 7 (will assume income spread evenly over each year) Avg donations per year 43 min endowment for building project $800 min cumulative campaign for building proj $200 First-year building cost $50 Second-year building cost $60 Weight given to previous year's spending 70%Calculations Year 0 1 2 3 4 5 6 7 8 9 10 Endowment at start of year 700.0 721.9 745.9 771.3 797.7 824.5 797.4 759.5 738.1 717.1 Endowment after annual return 742.0 765.2 790.6 817.6 845.6 874.0 845.2 805.1 782.4 760.1 Income Capital campaign income 42.9 42.9 42.9 42.9 42.9 42.9 42.9 0.0 0.0 0.0 cumulative campaign income 0.0 42.9 85.7 128.6 171.4 214.3 257.1 300.0 300.0 300.0 300.0 Expenses draw % for ongoing expenses 2.5% 2.5% 2.5% 2.5% 2.5% 3.0% 2.5% 2.5% 2.5% 2.5% Ongoing expenses 65.0 63.0 62.1 62.1 62.8 63.9 69.5 68.6 67.0 65.3 63.7 begin building (1) 0.0 0 building costs, year 1 0 0 O 50 0 O building costs, year 2 0 60 Net endowment at end of year 700.0 722 746 771 798 825 797 760 738 717 696
Step by Step Solution
There are 3 Steps involved in it

Get step-by-step solutions from verified subject matter experts