

Question: Excel format with formula Problems 4. Using the data for Clorox Company (NYSE: CLX), presented below: Fiscal Year Sales EBIT Interest Expense Total Net Income
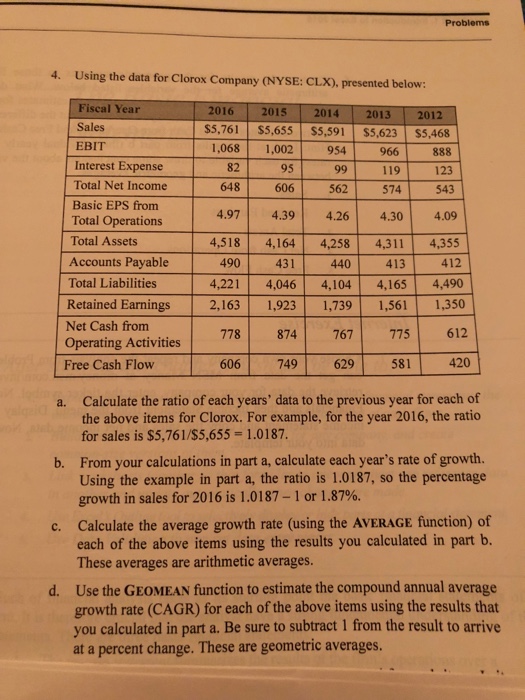
Problems 4. Using the data for Clorox Company (NYSE: CLX), presented below: Fiscal Year Sales EBIT Interest Expense Total Net Income Basic EPS from Total Operations 2016 2015 2014 2013 2012 S5,761 S5,655 $5,591 $5,623 $5,468 1,068 1,002 954 966 82 95 119 123 648 606 52 574 543 4.97 4.39 4.26 4.30 4.09 4,518 4,164 4,258 4,311 4,355 4,221 4,046 4,104 4,165 4,490 Total Assets Accounts Payable Total Liabilities Retained Earnings2,163 1,923 1,739 1,561 1,350 Net Cash from Operating Activities 778 874 76777561 490 431 440 413 Free Cash Flow 606 749 629 581 420 Calculate the ratio of each years' data to the previous year for each of the above items for Clorox. For example, for the year 2016, the ratio for sales is $5,761 /$5,655 = 1.0 1 87. a. From your calculations in part a, calculate each year's rate of growth. Using the example in part a, the ratio is 1.0187, so the percentage growth in sales for 2016 is 1.0187-1 or 1.87%. b. Calculate the average growth rate (using the AVERAGE function) of each of the above items using the results you calculated in part b. These averages are arithmetic averages. c. Use the GEOMEAN function to estimate the compound annual average growth rate (CAGR) for each of the above items using the results that you calculated in part a. Be sure to subtract 1 from the result to arrive at a percent change. These are geometric averages. d
Step by Step Solution
There are 3 Steps involved in it

Get step-by-step solutions from verified subject matter experts