

Question: Excel formulas only please c H A B D E F 1 Consider the following information. Your portfolio is invested 30 percent each in A
Excel formulas only please
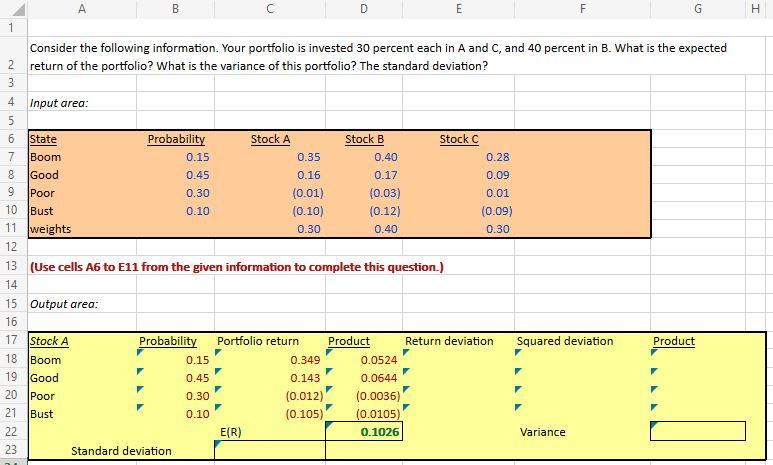
c H A B D E F 1 Consider the following information. Your portfolio is invested 30 percent each in A and C, and 40 percent in B. What is the expected 2 return of the portfolio? What is the variance of this portfolio? The standard deviation? 4 Input area: WNNO ovo AWN State Probability Stock A Stock B Stock C Boom 0.15 0.35 0.40 0.28 Good 0.45 0.16 0.17 0.09 Poor 0.30 (0.01) (0.03) 0.01 10 Bust 0.10 (0.10) (0.12) (0.09) 11 weights 0.30 0.40 0.30 12 13 (Use cells A6 to E11 from the given information to complete this question.) 14 15 Output area: 16 17 Stock A Probability Portfolio return Product Return deviation Squared deviation 18 Boom 0.15 0.349 0.0524 19 Good 0.45 0.143 0.0644 20 Poor 0.30 (0.012) (0.0036) 21 Bust 0.10 (0.105) (0.0105) 22 E(R) 0.1026 Variance 23 Standard deviation Product
Step by Step Solution
There are 3 Steps involved in it

Get step-by-step solutions from verified subject matter experts