

Question: excel: https://docs.google.com/spreadsheets/d/1vyArDwBoE8m1WnUeVS7ZOWl2O65zUn6w/edit?usp=sharing&ouid=113068968791942309329&rtpof=true&sd=true 1.Using the training data set create a histogram of FARE with 9 bins 2.Using the training data set only, create a boxplot of
excel:
https://docs.google.com/spreadsheets/d/1vyArDwBoE8m1WnUeVS7ZOWl2O65zUn6w/edit?usp=sharing&ouid=113068968791942309329&rtpof=true&sd=true 1.Using the training data set create a histogram of FARE with 9 bins 2.Using the training data set only, create a boxplot of DISTANCE, broken up by SW (in other words, two adjacent boxplots for routes where Southwest does and does not fly)
3. Use the PAIRS function in R to depict pairwise scatterplots of all numerical variables in the training data set (i.e., exclude the factor/character variables such as SW). 4. Using the training data set create a scatterplot of FARE (Y-axis) vs DISTANCE (X-axis). Use different colors or symbols to distinguish routes where Southwest is present (SW = Yes). (a) Insert the figure below and (b) explain briefly what you observe
5.
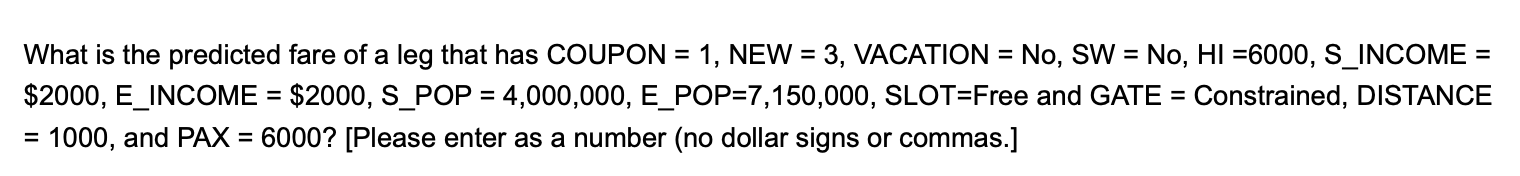
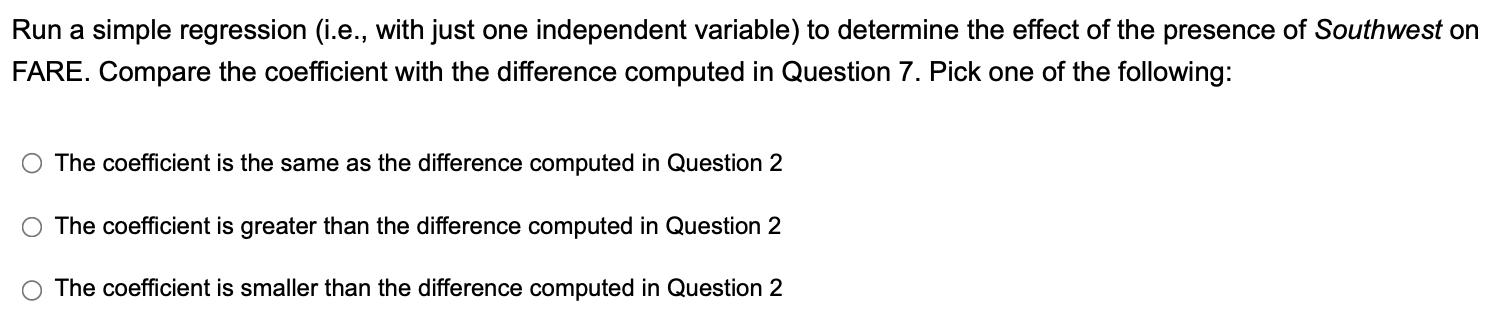
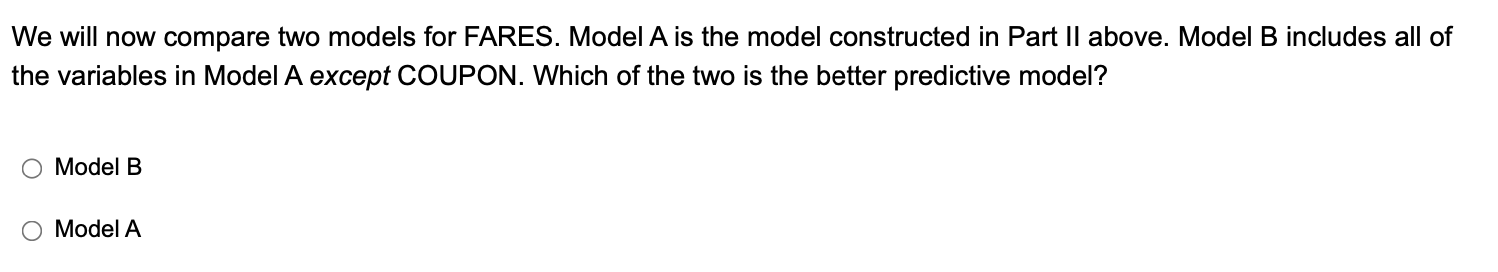
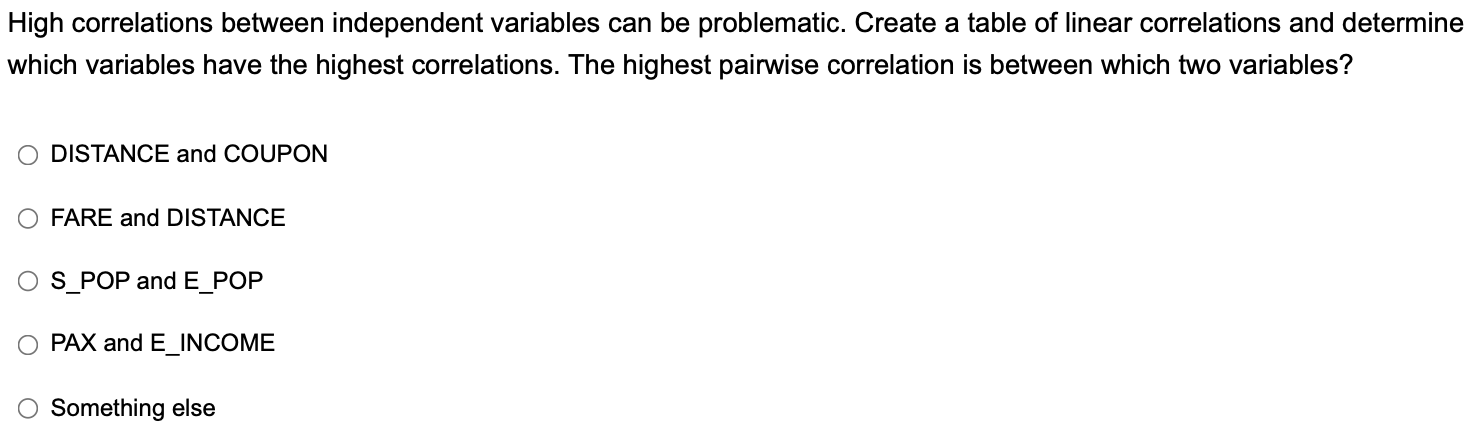
What is the predicted fare of a leg that has COUPON = 1, NEW = 3, VACATION = No, SW = No, HI =6000, S_INCOME = $2000, E_INCOME = $2000, S_POP = 4,000,000, E_POP=7,150,000, SLOT=Free and GATE = Constrained, DISTANCE = 1000, and PAX = 60007 [Please enter as a number (no dollar signs or commas.] Run a simple regression (i.e., with just one independent variable) to determine the effect of the presence of Southwest on FARE. Compare the coefficient with the difference computed in Question 7. Pick one of the following: O The coefficient is the same as the difference computed in Question 2 (O The coefficient is greater than the difference computed in Question 2 (O The coefficient is smaller than the difference computed in Question 2 We will now compare two models for FARES. Model A is the model constructed in Part Il above. Model B includes all of the variables in Model A except COUPON. Which of the two is the better predictive model? O Model B O Model A High correlations between independent variables can be problematic. Create a table of linear correlations and determine which variables have the highest correlations. The highest pairwise correlation is between which two variables? (O DISTANCE and COUPON O FARE and DISTANCE O S_POP and E_POP (O PAX and E_INCOME O Something else
Step by Step Solution
There are 3 Steps involved in it

Get step-by-step solutions from verified subject matter experts