

Question: Excel Instructions: Open a new Excel Blank Workbook A . Begin with header Sim 1 ( Centered , Bold ) in cell B 1 (
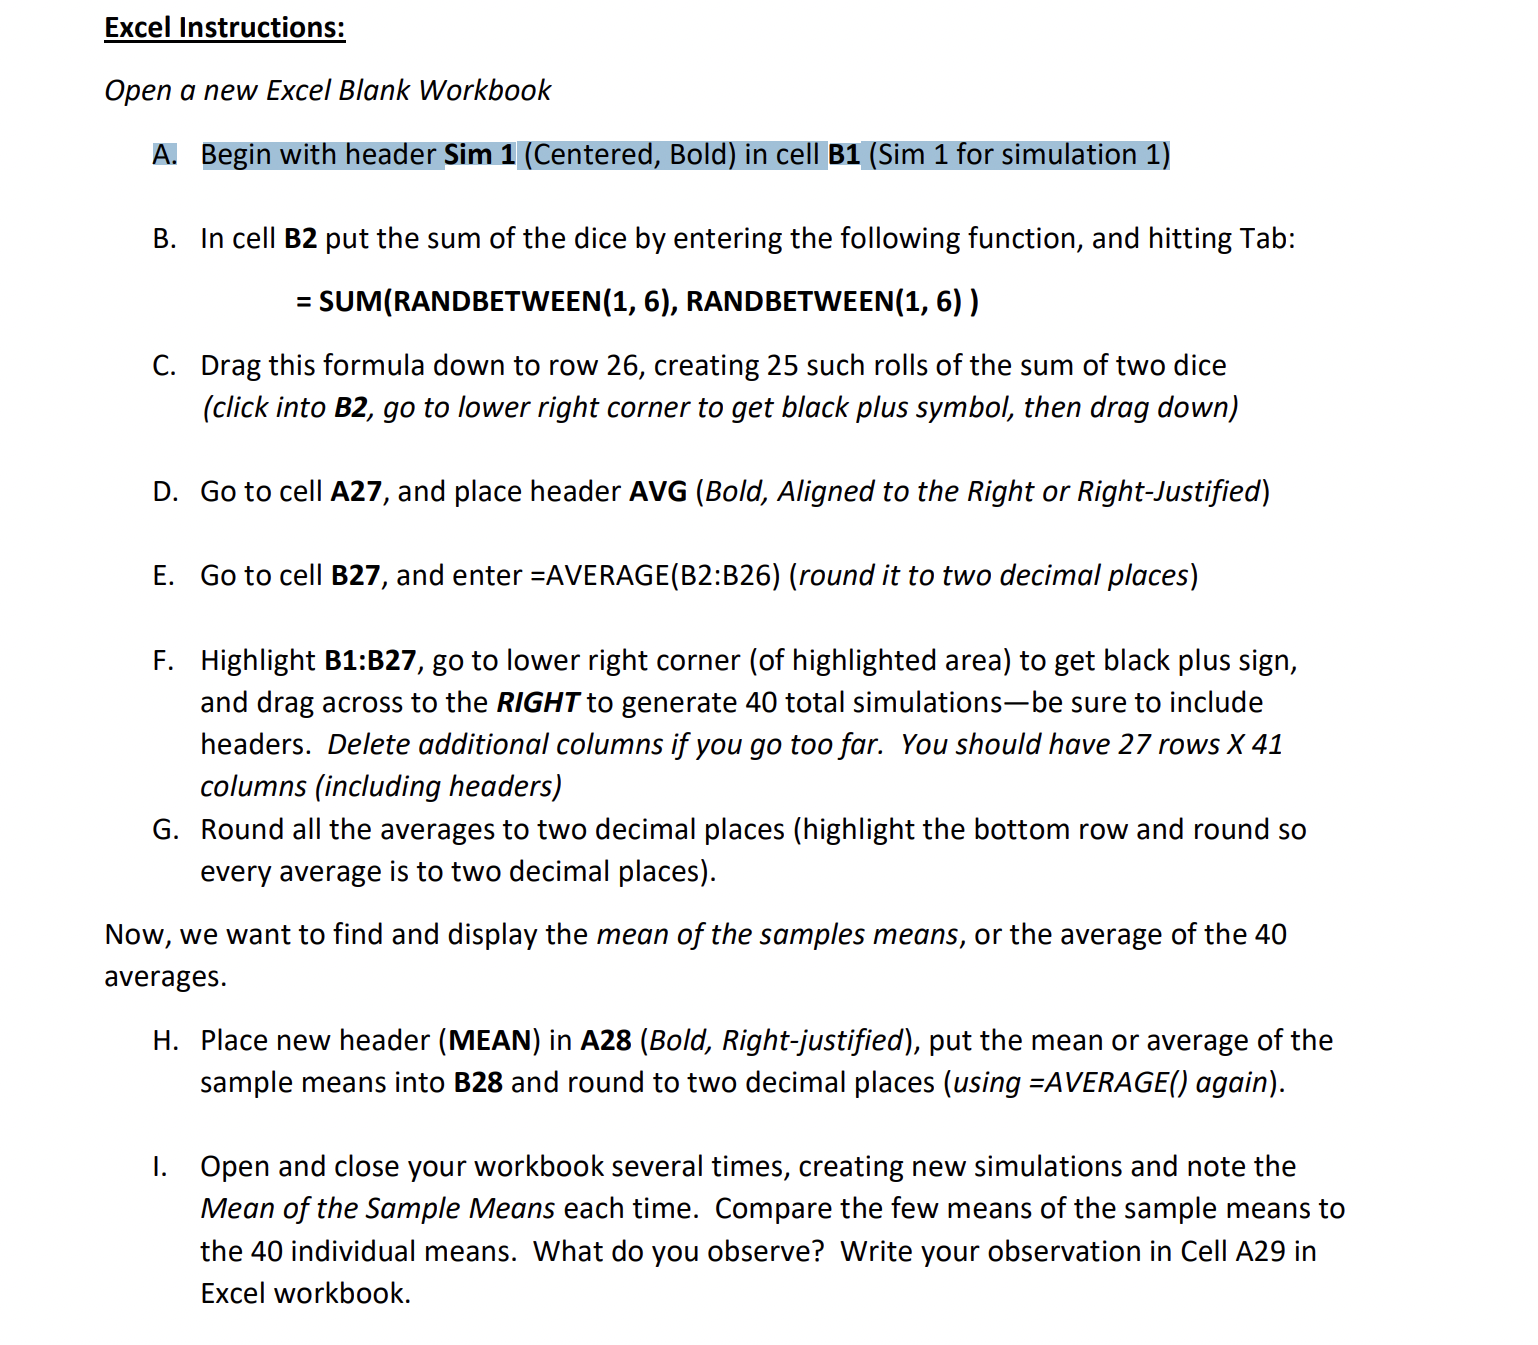
Excel Instructions:
Open a new Excel Blank Workbook
A Begin with header Sim Centered Bold in cell BSim for simulation
B In cell B put the sum of the dice by entering the following function, and hitting Tab:
SUMRANDBETWEEN RANDBETWEEN
C Drag this formula down to row creating such rolls of the sum of two dice
click into B go to lower right corner to get black plus symbol, then drag down
D Go to cell A and place header AVG Bold Aligned to the Right or RightJustified
E Go to cell B and enter AVERAGEB:Bround it to two decimal places
F Highlight B:B go to lower right corner of highlighted area to get black plus sign,
and drag across to the RIGHT to generate total simulationsbe sure to include
headers. Delete additional columns if you go too far. You should have rows
columns including headers
G Round all the averages to two decimal places highlight the bottom row and round so
every average is to two decimal places
Now, we want to find and display the mean of the samples means, or the average of the
averages.
H Place new header MEAN in ABold Rightjustified put the mean or average of the
sample means into B and round to two decimal places using AVERAGE again
I. Open and close your workbook several times, creating new simulations and note the
Mean of the Sample Means each time. Compare the few means of the sample means to
the individual means. What do you observe? Write your observation in Cell A in
Excel workbook.
Step by Step Solution
There are 3 Steps involved in it
1 Expert Approved Answer
Step: 1 Unlock

Question Has Been Solved by an Expert!
Get step-by-step solutions from verified subject matter experts
Step: 2 Unlock
Step: 3 Unlock