

Question: excel link: https://moodle.greensboro.edu/mod/resource/view.php?id=177024 Steps 1 Download the excel le titled 'COVID-lS-zeographic-disbtribution-worldwide to your computer. lhis is your main data source It contains upto-date information about
excel link: https://moodle.greensboro.edu/mod/resource/view.php?id=177024
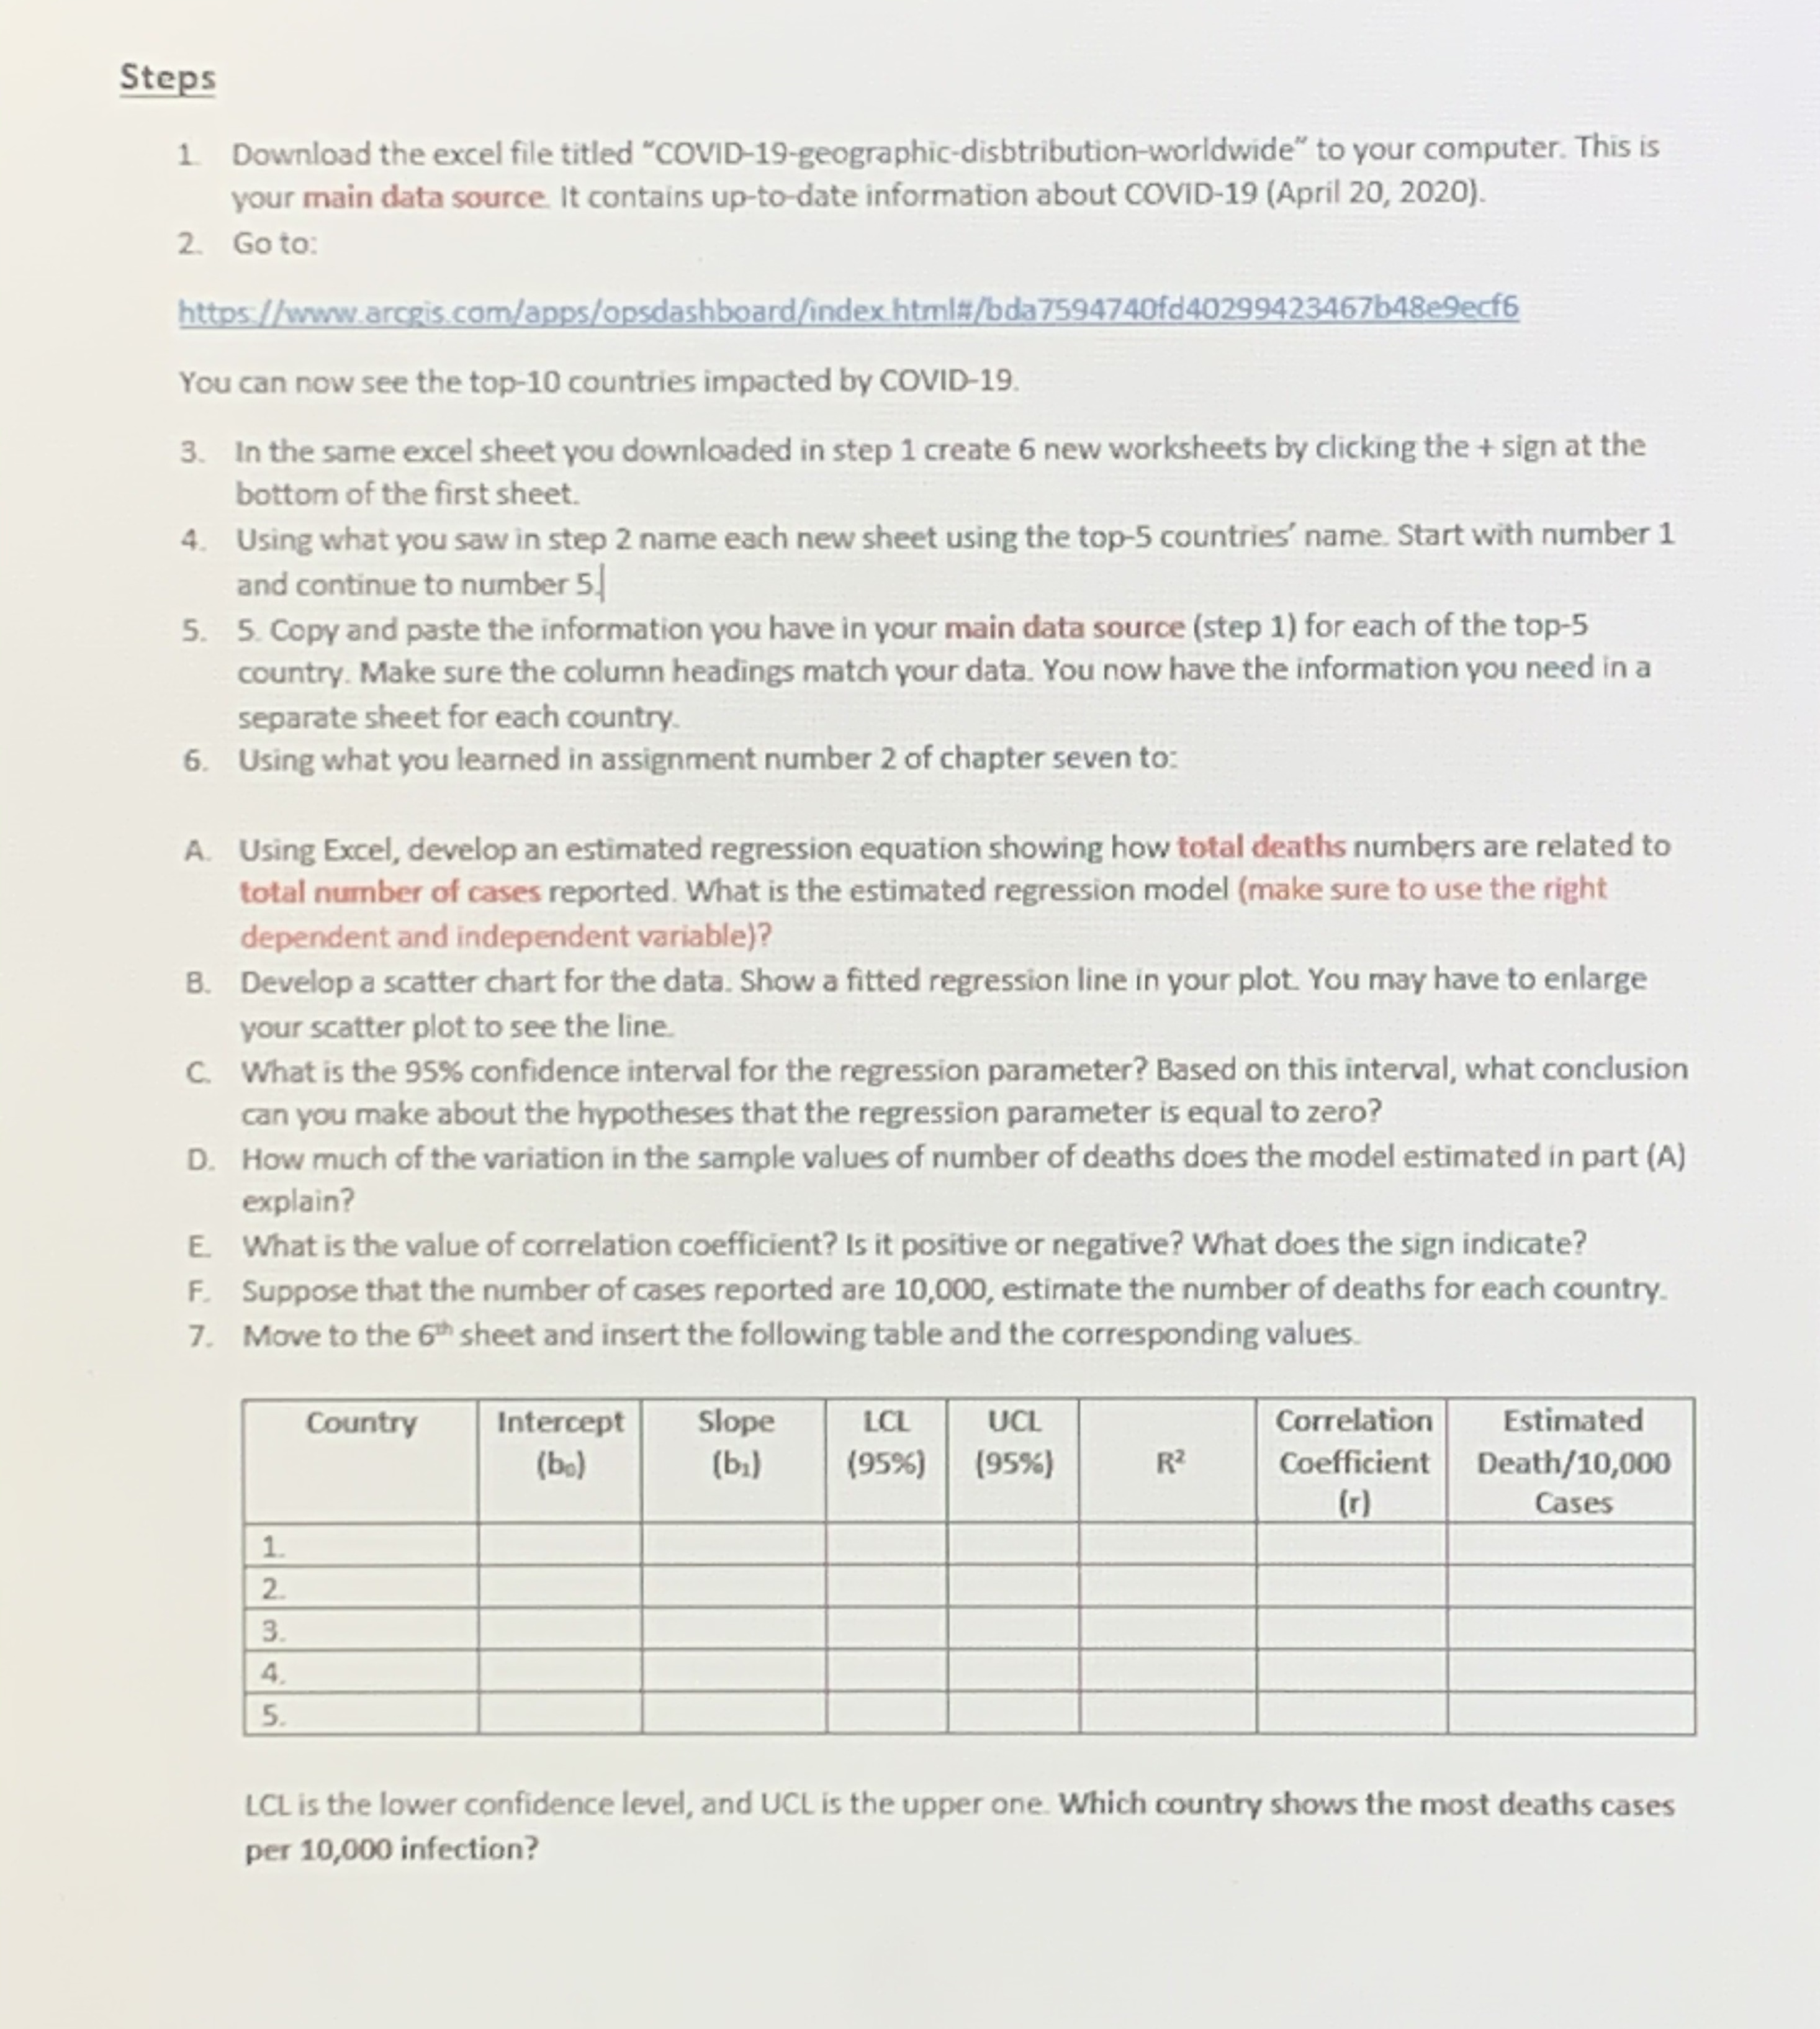
Steps 1 Download the excel le titled 'COVID-lS-zeographic-disbtribution-worldwide\" to your computer. lhis is your main data source It contains upto-date information about COVID-19 (April 20, 2020). 2 Go to: hm,lMagzisggmMngghmardbndethlgdamnoldwg2M You can now see the top-10 countries impacted by COVID-19. 3. In the same excel sheetyou downloaded in step 1 create 6 new worksheets by clicking the + sign at the bottom of the rst sheet. 4. Using what you saw In step 2 name each new sheet using the top-5 countr'ls' name. Start with number 1 and continue to number 51 5. 5. Copy and paste the information you have In your main data source (step 1) for each of the top-5 country. Make sure the column headings matdt your data. You now have the information you need in a separate sheet for each country. 6. Using what you learned in assignment number 2 of chapter seven to: A Using Excel, develop an estimated remion equation showing how total deaths numbers are related to total nunber at oases reported. What is the estimated regression model (make sure to use the right dependent and independent variable)? 8. Develop a scatter chart for the data. Show a tted regression line In your plot. You may have to enlarge your scatter plot to see the line. c. What is the 95% condence interval for the regression parameter? Based on this interval, what conclusion can you make about the hypotheses that the regression parameter is equal to zero? 0. How mudi of the variation In the sample values of number of deaths does the model estimated in part (A) explain? E What is the value of correlation coefficient? Is it positive or negative? What does the sign indicate? F- Suppose that the number of cases reported are 10,000, estimate the number of deaths for each country. 7. Move to the 9' sheet and Insert the following table and the corresponding values Intercept Estimated (be) [51' Coefcient Death/10, 000 M Cases LCL is the lower condence level, and UCL Is the upper one. Whlch country shows the most deaths cases per 10,000 infection
Step by Step Solution
There are 3 Steps involved in it

Get step-by-step solutions from verified subject matter experts