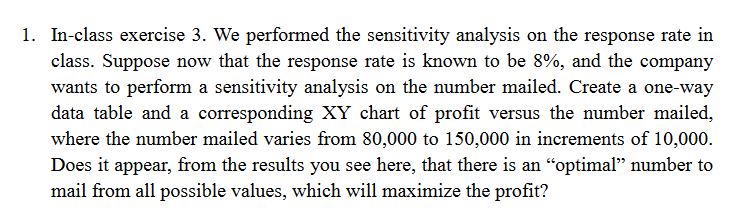
Question: - Excel Modeling In-class exercise 3 . We performed the sensitivity analysis on the response rate in class. Suppose now that the response rate is

- Excel Modeling In-class exercise 3 . We

- Excel Modeling In-class exercise 3 . We

- Excel Modeling In-class exercise 3 . We performed the sensitivity analysis on the response rate in class. Suppose now that the response rate is known to be 8%, and the company wants to perform a sensitivity analysis on the number mailed. Create a one-way data table and a corresponding XY chart of profit versus the number mailed, where the number mailed varies from 80,000 to 150,000 in increments of 10,000 . Does it appear, from the results you see here, that there is an "optimal" number to mail from all possible values, which will maximize the profit

Step by Step Solution

There are 3 Steps involved in it

1 Expert Approved Answer
Step: 1 Unlock blur-text-image
Question Has Been Solved by an Expert!

Get step-by-step solutions from verified subject matter experts

Step: 2 Unlock
Step: 3 Unlock

Students Have Also Explored These Related General Management Questions!