

Question: EXCEL Needed Using the data below. A breakeven analysis is needed. With a graph that displays the intersection of the total cost lines (breakeven points)
EXCEL Needed
Using the data below. A breakeven analysis is needed. With a graph that displays the intersection of the total cost lines (breakeven points) in excel please.
Here is the problem worked out:
Two different manufacturing processes are being considered for making a new product. The first process is less capital-intensive, with fixed costs of only $52,600 per year and variable costs of $650 per unit. The second process has fixed costs of $408,000 but variable costs of only $220 per unit.
What is the break-even quantity, beyond which the second process becomes more attractive than the first?
The volume at which the second process becomes more attractive is 827 units.
Detail: Plot total cost columns in line chart. Quantity in x-axis. Increase max quantity as needed to see all intersections.
I need the image of how to do it in excel.
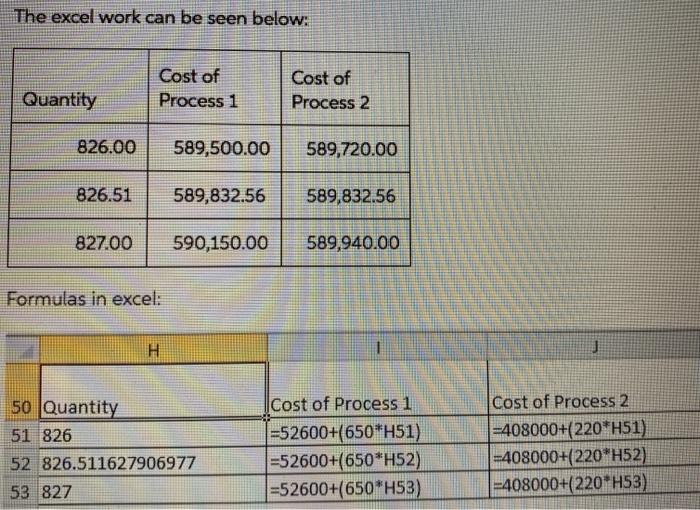
The excel work can be seen below: Cost of Process 1 Quantity Cost of Process 2 826.00 589,500.00 589,720.00 826.51 589,832.56 589,832.56 827.00 590,150.00 589,940.00 Formulas in excel: H 50 Quantity 51 826 52 826.511627906977 53 827 Cost of Process 1 =52600+(650*H51) =52600+(650*H52) =52600+(650*H53) Cost of Process 2 =408000+(220*151) -408000+(220*H52) -408000+(220"H53)Step by Step Solution
There are 3 Steps involved in it

Get step-by-step solutions from verified subject matter experts