

Question: Excel One Structured Activity: NPV profiles A company is considering two mutually exclusive expansion plans. Plan Arequires a 141 million expenditure on a large scale
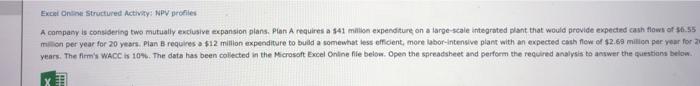
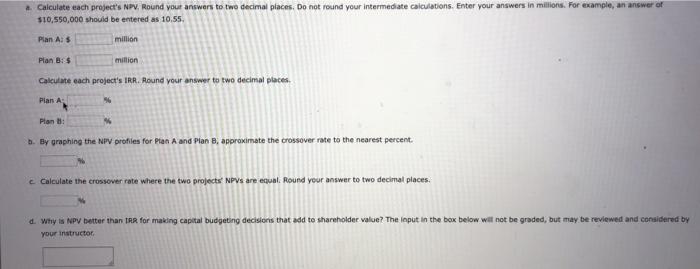
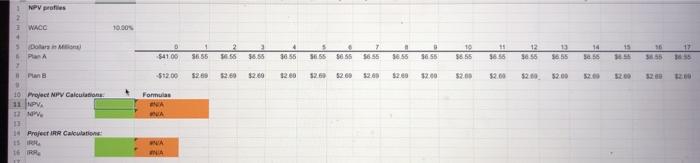
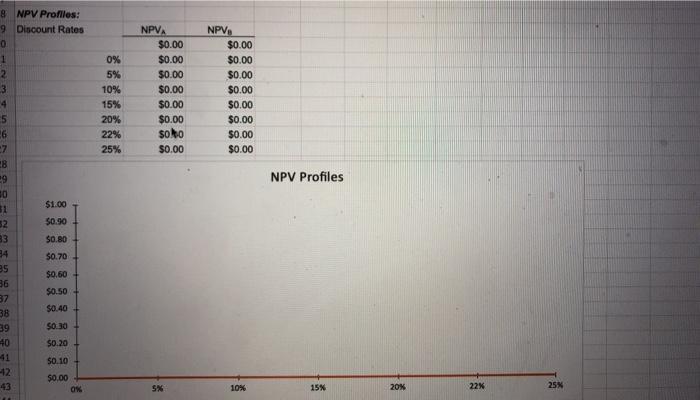
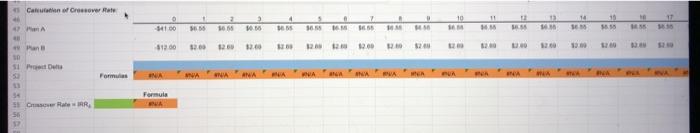
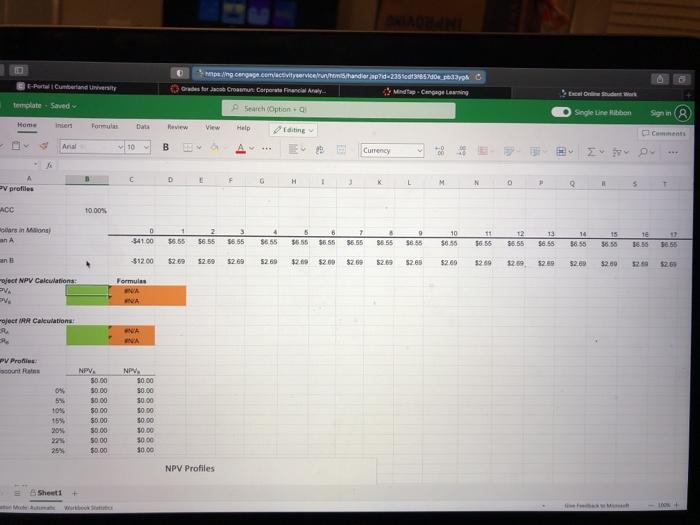
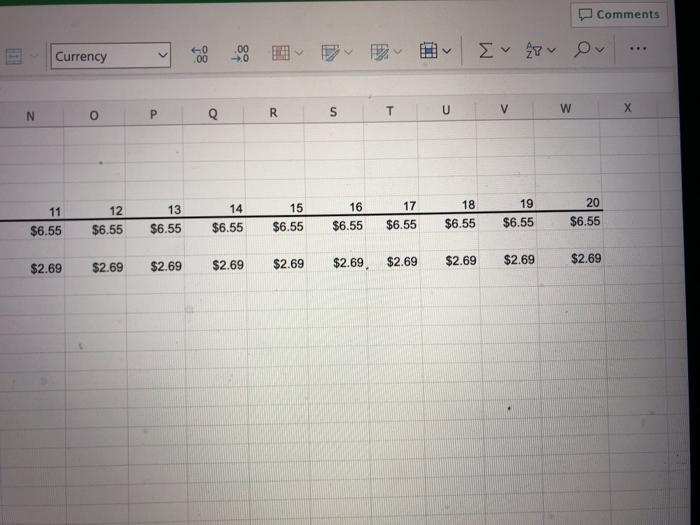
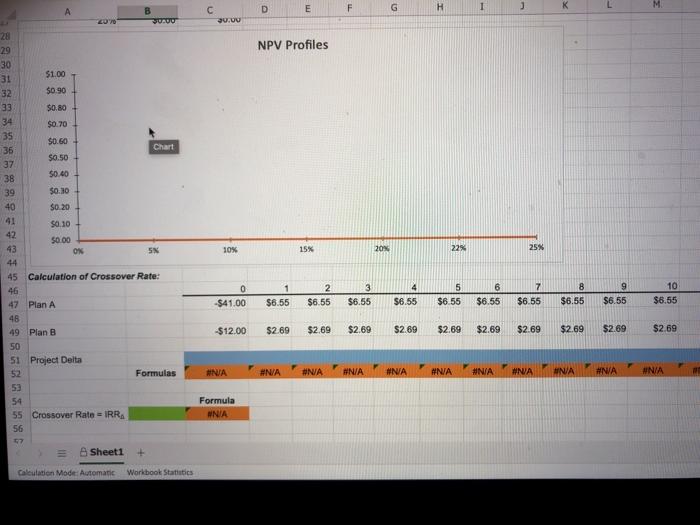
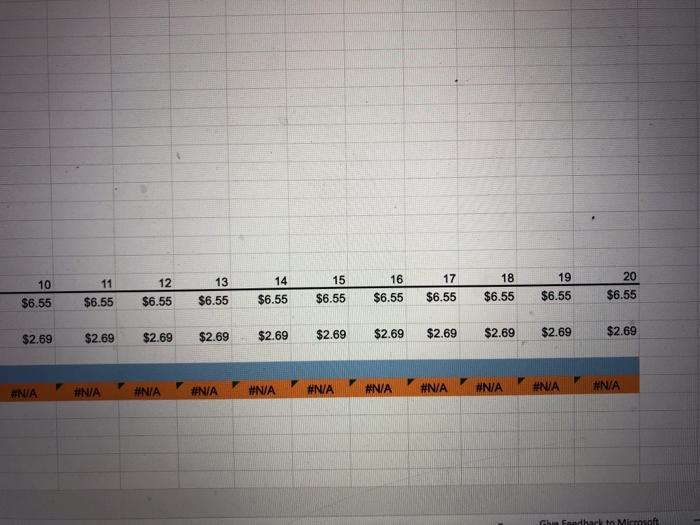
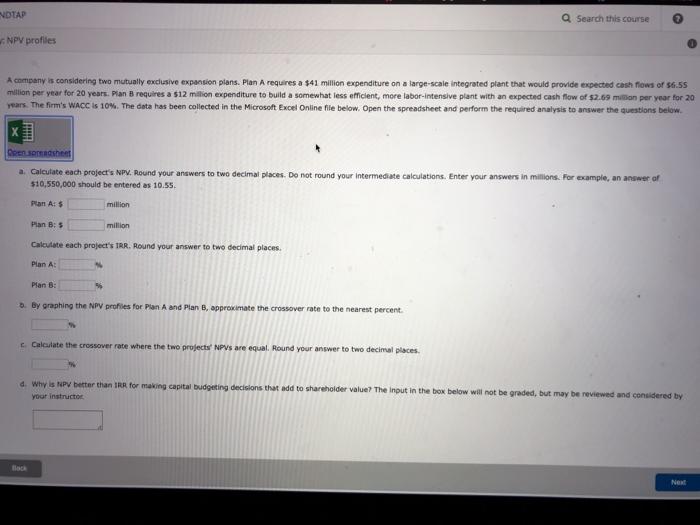
Excel One Structured Activity: NPV profiles A company is considering two mutually exclusive expansion plans. Plan Arequires a 141 million expenditure on a large scale integrated plant that would provide expected cash flows of $6.55 mon per year for 20 years, Plan B requires a $12 million expenditure to build a somewhat less efficient, more ubor-intensive plant with an expected cash flow of $2.69 million per year for 2 years. The firm's WACC is 10%. The data has been collected in the Microsoft Excel Online file below. Open the spreadsheet and perform the required analysis to answer the questions below . Calculate each project's NPV Round your answers to two decimal places. Do not round your intermediate calculations. Enter your answers in millions. For example, an answer of $10,550,000 should be entered as 10:55 Plan AS million Plan B: 5 million Calculate each project's IRR. Round your answer to two decimal places Pian A 96 Plan : . By graphing the NPV profiles for Pian A and Plan B, approximate the crossover rate to the nearest percent. Calculate the crossover rate where the two projects NPVs are equal. Round your answer to two decimal places. d. Why NPV better than the for making capital budgeting decisions that add to shareholder value? The laput in the box below will not be graded, but may be reviewed and considered by your instructor 10.00% 1. NPV pros 2 WACC 4 5 Dolar Plan 11 $856 15 13 56.55 17 14 $8.55 $4100 56.55 SE55 36.55 5656 10 $5.55 56.55 3655 12 3855 5655 36.55 5656 Plan -$12.00 5250 12.60 $2.00 22.60 12.60 5260 1260 $2.00 1200 52.00 $2.00 5200 52.00 Fomus 10 Project NPV Calculations 11 PV 11 MV, WA 14 Project IRR Calculation 15 WA INA 0% 5% 10% 15% 20% 22% 25% NPVA $0.00 $0.00 $0.00 $0.00 $0.00 $0.00 Solo $0.00 NPV $0.00 $0.00 $0.00 $0.00 $0.00 $0.00 $0.00 $0.00 NPV Profiles 8 NPV Profilles: 9 Discount Rates 0 1 2 3 4 5 26 7 B 29 30 51 $1.00 52 $0.90 33 $0.80 34 50.70 35 $0.60 36 $0.50 37 38 $0.40 39 $0.30 40 $0.20 41 $0.10 sx 43 $0.00 OX % 10% 15% 20% 22% 25% 43 Cautation of Crossover Rate O 2 4 10 11 13 2 16 14 2 30.55 5 365 999 WH W VE Phan -812.00 32.00 12.00 BESAR SIP Delle INA Forms WA ANAHUA WA NAVA MER BUA NA WA VE Formula BUA Cale RR Mping cengag.com es vityservice forhandlers?id-2353650 pero for Croam Corporate Financial Analy Moda Carage Long - Curtand Unity template. Saved Search Option Single Linen Sign in Home Inten Formula Data ave View Help Editing Anal 10 B Currency B D A V profiles F G H L M N 5 ACC 10.00% lars in Mona an A 0 -$4100 $5.55 $6.55 55 55 7 5555 $6.55 1655 5656 $8.55 9 $8.55 10 $8.50 12 55.55 13 $6.55 56.55 14 3655 15 36.58 Te 16.36 $12.00 $2.59 52.69 $2.00 $2.00 $2.00 52.65 $2.60 $269 $2.89 529 $2.89 $2.80 5260 ject NPV Calculations VA Formulas ENA VA ject RR Calculations NA NA V Profile count 0% 5 10% NPV $0.00 50.00 $0.00 $0.00 $0.00 50.00 $0.00 $0.00 NPV, SO 00 50.00 50.00 $0.00 $0.00 30.00 $0.00 $0.00 15% 90% 25% NPV Profiles Sheet1 Comments .00 60 .00 V Currency 7 P R O T S W N Q U V 17 11 $6.55 12 $6.55 13 $6.55 14 $6.55 15 $6.55 16 $6.55 18 $6.55 19 $6.55 20 $6.55 $6.55 $2.69 $2.69 $2.69 $2.69 $2.69 $2.69 $2.69 $2.69 $2.69 $2.69 D E F G H 1 K 20.00 NPV Profiles A B WUUU 28 29 30 31 $1.00 32 $0.90 33 $0.80 34 $0.70 35 $0.60+ 36 Chart 37 $0.50 38 $0.40 39 50.30 40 $0 20 41 $0.10 42 50.00 43 ON SK 44 45 Calculation of Crossover Rate: 46 47 Plan A 48 49 Plan B 50 51 Project Delta Formulas 53 54 55 Crossover Rate = IRRA 56 57 Sheet1 + 10% 15% 20% 22% 25% 0 4 6 8 1 $6.55 2. $6.55 3 $6.55 5 $6.55 7 $6.55 9 $6.55 10 $6.55 -$41.00 $6.55 $6.55 $6.55 -$12.00 $2.69 $2.69 $2.69 $2.69 $2.69 $2.69 $2.69 $2.69 $2.69 $2.69 #N/A #N/A #NA #N/A #NA #N/A #N/A #NA MNA #N/A #N/A Formula WNA Calculation Mode: Automatic Workbook Statistics NOTAP Q Search this course NPV profiles A company is considering two mutually exclusive expansion plans. Plan A requires a $41 million expenditure on a large-scale integrated plant that would provide expected cash flows of 56.55 million per year for 20 years, Plan B requires a $12 milion expenditure to build a somewhat less efficient, more labor-intensive plant with an expected cash flow of $2.69 million per year for 20 years. The firm's WACC is 10%. The data has been collected in the Microsoft Excel Online file below. Open the spreadsheet and perform the required analysis to answer the questions below. H Open she a Calcutate each project's NP. Round your answers to two decimal places. Do not round your intermediate calculations. Enter your answers in millons. For example, an answer of $10,550,000 should be entered as 10.55. Plan At $ million Plan B: 5 million Calculate each project's TRR. Round your answer to two decimal places. Plan A: Plan 8: 5. By graphing the NPV profiles for Plan A and Plan B, approximate the crossover rate to the nearest percent Calculate the crossover rate where the two projects' NPVs are equal. Round your answer to two decimal places a. Why is NPV better than IRA for making capital budgeting decisions that add to shareholder value? The input in the box below will not be graded, but may be reviewed and considered by your instructor Next
Step by Step Solution
There are 3 Steps involved in it

Get step-by-step solutions from verified subject matter experts