

Question: Excel Online Structured Activity : Project risk analysis The Butler-Perkins Company (BPC) must decide between two mutually exclusive projects. Each costs $6,750 and has an
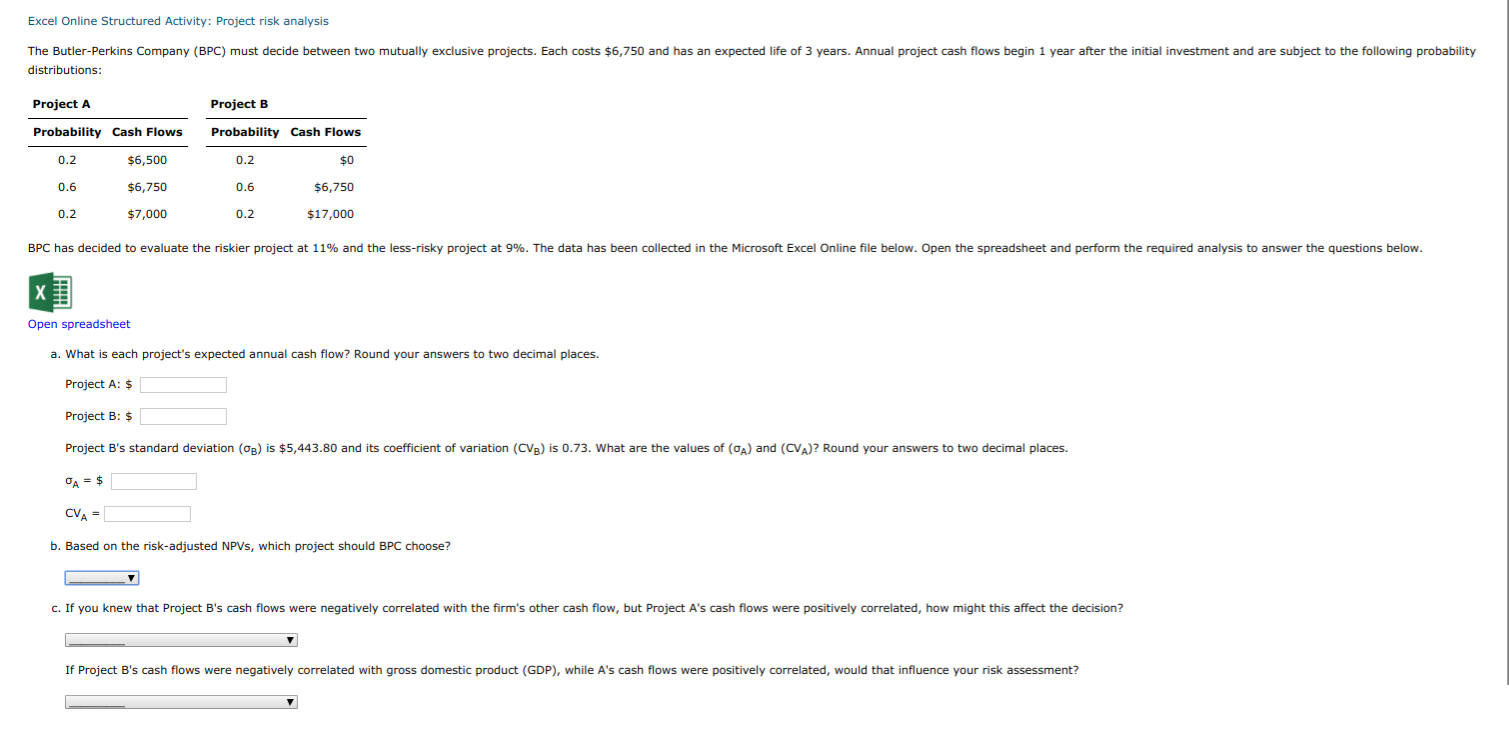
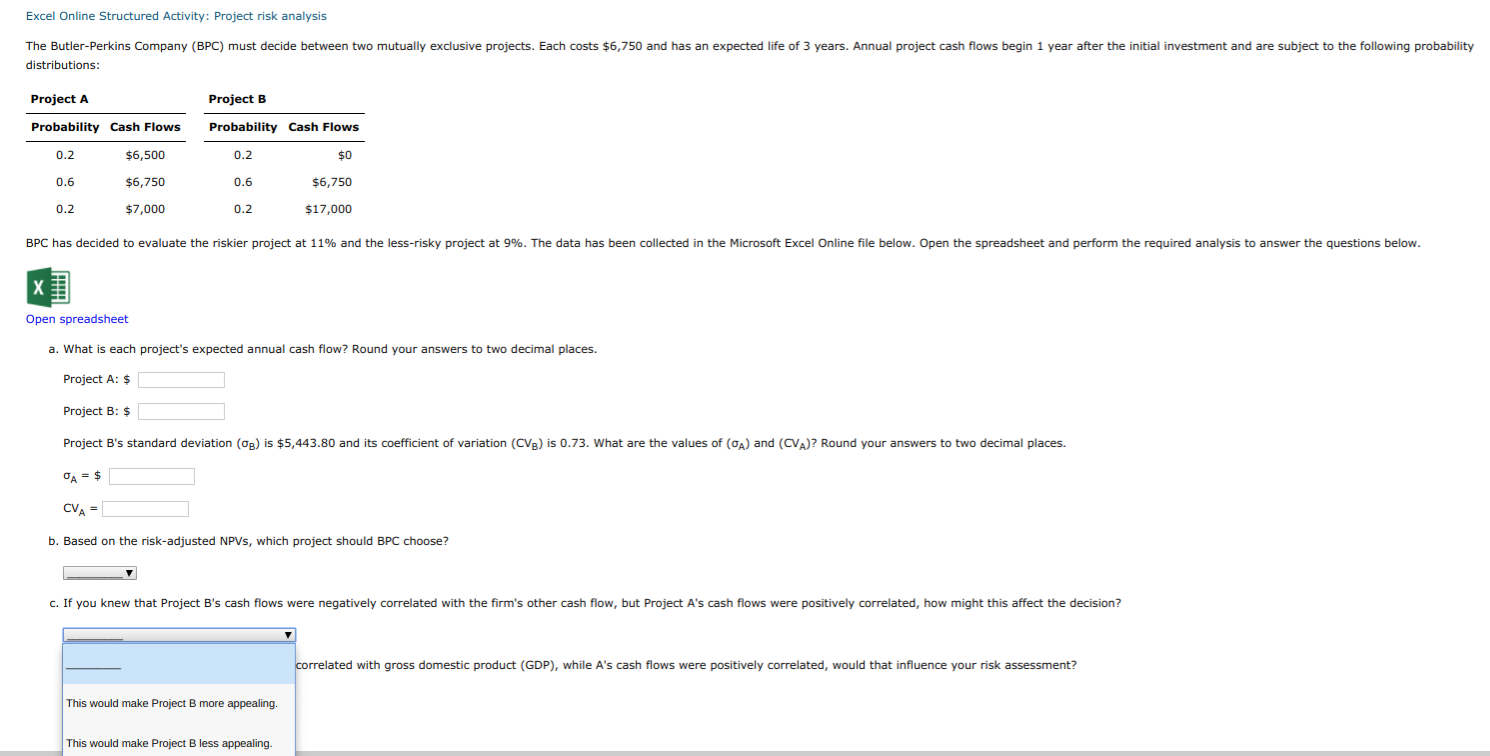
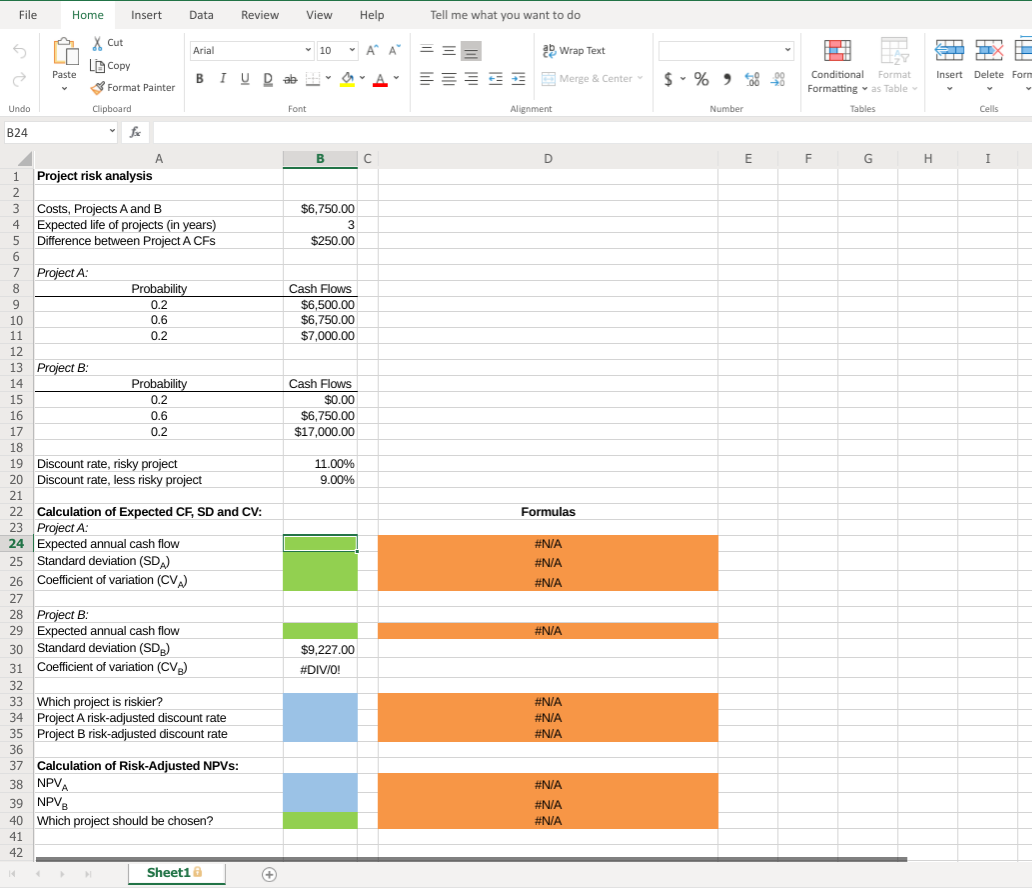
Excel Online Structured Activity : Project risk analysis The Butler-Perkins Company (BPC) must decide between two mutually exclusive projects. Each costs $6,750 and has an expected life of 3 years. Annual project cash flows begin 1 year after the initial investment and are subject to the following probability distributions: Project A Project B Probability Cash Flows Probability Cash Flows $6,500 0.2 0.2 $0 $6,750 0.6 $6,750 0.6 0.2 $17,000 0.2 $7,000 BPC has decided to evaluate the riskier project at 11% and the less-risky project at 9%. The data has been collected in the Microsoft Excel Online file below. Open the spreadsheet and perform the required analysis to answer the questions below. Open spreadsheet a. What is each project's expected annual cash flow? Round your answers to two decimal places. Project A: Project B: Project B's standard deviation (o) is $5,443.80 and its coefficient of variation (CV) is 0.73. What are the values of (o) and (CVA)? Round your answers to two decimal places. $ CVA b. Based on the risk-adjusted NPVS, which project should BPC choose? c. If you knew that Project B'ss cash flows were negatively correlated with the firm's other cash flow, but Project A's cash flows were positively correlated, how might this affect the decision? If Project B's cash flows were negatively correlated with gross domestic product (GDP), while A's cash flows were positively correlated, wou ld that influence your risk assessment? Excel Online Structured Activity: Project risk analysis The Butler-Perkins Company (BPC) must decide between two mutually exclusive projects. Each costs $6,750 and has an expected life of 3 years. Annual project cash flows begin 1 year after the initial investment and are subject to the following probability distributions: Project A Project B Probability Cash Flows Probability Cash Flows 0.2 $6,500 0.2 $0 $6,750 $6,750 0.6 0.6 $7,000 0.2 0.2 $17,000 BPC has decided to evaluate the riskier project at 11% and the less-risky project at 9%. The data has been collected in the Microsoft Excel Online file below. Open the spreadsheet and perform the required analysis to answer the questions below. Open spreadsheet a. What is each project's expected annual cash flow? Round your answers to two decimal places Project A: $ Project B: Project B's standard deviation (o) is $5,443.80 and its coefficient of variation (CVB) is 0.73. What are the values of (o) and (CVA)? Round your answers to two decimal places. CVA b. Based on the risk-adjusted NPVS, which project should BPC choose? c. If you knew that Project B'ss cash flows were negatively correlated with the firm's other cash flow, but Project A's cash flows were positively correlated, how might this affect the decision? correlated with gross domestic product (GDP), while A's cash flows were positively correlated, would that influence your risk assessment? This would make Project more appealing. This would make Project B less appealing. Tell me what you want to do File Data Review View Help Home Insert X Cut === A A abWrap Text Arial X 10 LCopy y BIUD ab Merge & Center Conditional Format Paste Delete Form Insert EEEE Format Painter Formatting as Table Clipboard Number Undo Font Alignment Tables Cells B24 A C E F G H I Project risk analysis 1 2 3 Costs, Projects A and B Expected life of projects (in years) Difference between Project A CFs $6,750.00 4 3 $250.00 5 6 7 Project A: Cash Flows 8 Probability 9 0.2 $6,500.00 $6,750.00 $7,000.00 0.6 10 11 0.2 12 . 13 Project B: Cash Flows 14 Probability $0.00 $6.750.00 $17,000.00 15 0.2 16 0.6 17 0.2 18 Discount rate, risky project Discount rate, less risky project 19 11.00% 20 9.00% 21 22 Calculation of Expected CF, SD and CV: 23 Project A: 24 Expected annual cash flow 25 Standard deviation (SD Formulas #N/A #N/A 26 Coefficient of variation (CVA #N/A 27 28 Project B: 29 Expected annual cash flow #N/A Standard deviation (SDa) 30 $9,227.00 Coefficient of variation (CVg) 31 #DIV/O! 32 Which project is riskier? Project A risk-adjusted discount rate Project B risk-adjusted discount rate 33 #N/A 34 #N/A 35 #N/A 36 Calculation of Risk-Adjusted NPVS: 37 38 NPVA 39 NPVB #N/A #N/A 40 Which project should be chosen? #N/A 41 42 Sheet1 + Excel Online Structured Activity : Project risk analysis The Butler-Perkins Company (BPC) must decide between two mutually exclusive projects. Each costs $6,750 and has an expected life of 3 years. Annual project cash flows begin 1 year after the initial investment and are subject to the following probability distributions: Project A Project B Probability Cash Flows Probability Cash Flows $6,500 0.2 0.2 $0 $6,750 0.6 $6,750 0.6 0.2 $17,000 0.2 $7,000 BPC has decided to evaluate the riskier project at 11% and the less-risky project at 9%. The data has been collected in the Microsoft Excel Online file below. Open the spreadsheet and perform the required analysis to answer the questions below. Open spreadsheet a. What is each project's expected annual cash flow? Round your answers to two decimal places. Project A: Project B: Project B's standard deviation (o) is $5,443.80 and its coefficient of variation (CV) is 0.73. What are the values of (o) and (CVA)? Round your answers to two decimal places. $ CVA b. Based on the risk-adjusted NPVS, which project should BPC choose? c. If you knew that Project B'ss cash flows were negatively correlated with the firm's other cash flow, but Project A's cash flows were positively correlated, how might this affect the decision? If Project B's cash flows were negatively correlated with gross domestic product (GDP), while A's cash flows were positively correlated, wou ld that influence your risk assessment? Excel Online Structured Activity: Project risk analysis The Butler-Perkins Company (BPC) must decide between two mutually exclusive projects. Each costs $6,750 and has an expected life of 3 years. Annual project cash flows begin 1 year after the initial investment and are subject to the following probability distributions: Project A Project B Probability Cash Flows Probability Cash Flows 0.2 $6,500 0.2 $0 $6,750 $6,750 0.6 0.6 $7,000 0.2 0.2 $17,000 BPC has decided to evaluate the riskier project at 11% and the less-risky project at 9%. The data has been collected in the Microsoft Excel Online file below. Open the spreadsheet and perform the required analysis to answer the questions below. Open spreadsheet a. What is each project's expected annual cash flow? Round your answers to two decimal places Project A: $ Project B: Project B's standard deviation (o) is $5,443.80 and its coefficient of variation (CVB) is 0.73. What are the values of (o) and (CVA)? Round your answers to two decimal places. CVA b. Based on the risk-adjusted NPVS, which project should BPC choose? c. If you knew that Project B'ss cash flows were negatively correlated with the firm's other cash flow, but Project A's cash flows were positively correlated, how might this affect the decision? correlated with gross domestic product (GDP), while A's cash flows were positively correlated, would that influence your risk assessment? This would make Project more appealing. This would make Project B less appealing. Tell me what you want to do File Data Review View Help Home Insert X Cut === A A abWrap Text Arial X 10 LCopy y BIUD ab Merge & Center Conditional Format Paste Delete Form Insert EEEE Format Painter Formatting as Table Clipboard Number Undo Font Alignment Tables Cells B24 A C E F G H I Project risk analysis 1 2 3 Costs, Projects A and B Expected life of projects (in years) Difference between Project A CFs $6,750.00 4 3 $250.00 5 6 7 Project A: Cash Flows 8 Probability 9 0.2 $6,500.00 $6,750.00 $7,000.00 0.6 10 11 0.2 12 . 13 Project B: Cash Flows 14 Probability $0.00 $6.750.00 $17,000.00 15 0.2 16 0.6 17 0.2 18 Discount rate, risky project Discount rate, less risky project 19 11.00% 20 9.00% 21 22 Calculation of Expected CF, SD and CV: 23 Project A: 24 Expected annual cash flow 25 Standard deviation (SD Formulas #N/A #N/A 26 Coefficient of variation (CVA #N/A 27 28 Project B: 29 Expected annual cash flow #N/A Standard deviation (SDa) 30 $9,227.00 Coefficient of variation (CVg) 31 #DIV/O! 32 Which project is riskier? Project A risk-adjusted discount rate Project B risk-adjusted discount rate 33 #N/A 34 #N/A 35 #N/A 36 Calculation of Risk-Adjusted NPVS: 37 38 NPVA 39 NPVB #N/A #N/A 40 Which project should be chosen? #N/A 41 42 Sheet1 +
Step by Step Solution
There are 3 Steps involved in it

Get step-by-step solutions from verified subject matter experts