

Question: excel only. formulas to prove step by step Data begin{tabular}{|c|c|c|c|c|c|c|c|c|c|} hline multicolumn{3}{|c|}{ Partelpants } & & & & & & & hline Year &
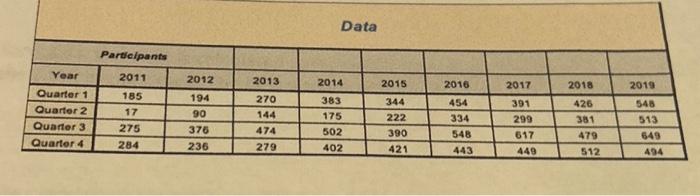
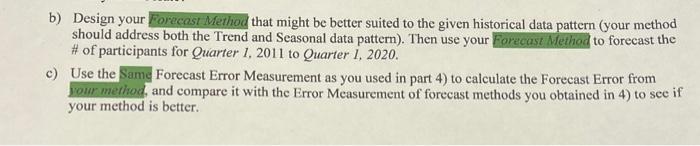
Data \begin{tabular}{|c|c|c|c|c|c|c|c|c|c|} \hline \multicolumn{3}{|c|}{ Partelpants } & & & & & & & \\ \hline Year & 2011 & 2012 & 2013 & 2014 & 2015 & 2016 & 2017 & 2018 & 2019 \\ \hline Ouarter 1 & 185 & 194 & 270 & 383 & 344 & 454 & 391 & 426 & 548 \\ \hline Ouarter 2 & 17 & 90 & 144 & 175 & 222 & 334 & 299 & 381 & 513 \\ \hline Ouarter 3 & 275 & 376 & 474 & 502 & 390 & 548 & 617 & 479 & 649 \\ \hline Ouarter 4 & 284 & 236 & 279 & 402 & 421 & 443 & 449 & 512 & 494 \\ \hline \end{tabular} b) Design your Forecast Method that might be better suited to the given historical data pattern (your method should address both the Trend and Seasonal data pattern). Then use your Eorecast Method to forecast the \# of participants for Quarter 1, 2011 to Quarter 1, 2020. c) Use the Same Forecast Error Measurement as you used in part 4) to calculate the Forecast Error from Dour method, and compare it with the Error Measurement of forecast methods you obtained in 4) to see if your method is better
Step by Step Solution
There are 3 Steps involved in it

Get step-by-step solutions from verified subject matter experts