

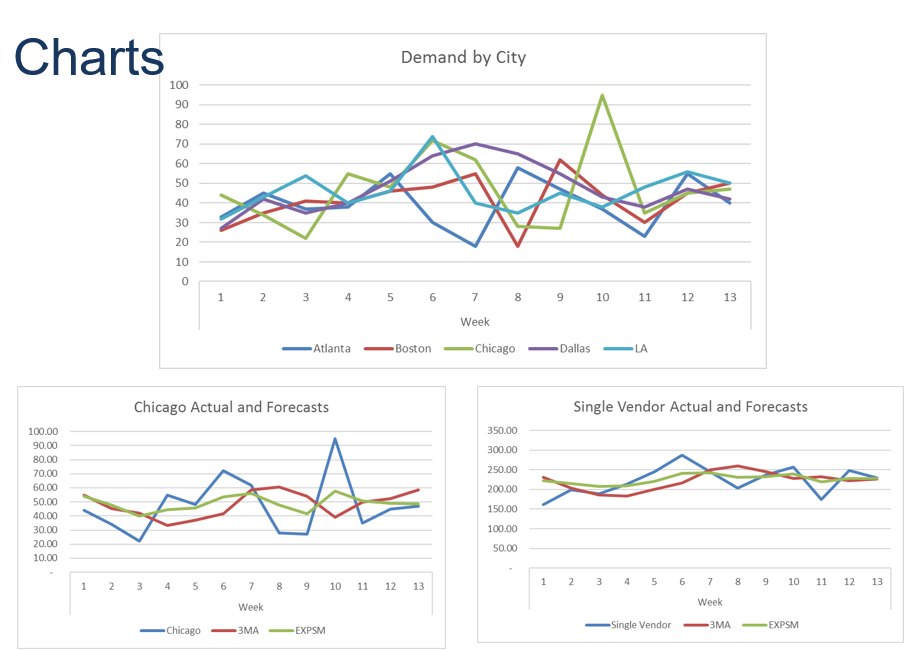
Question: excel please undefined Forecasting Methods Excel is a great tool for forecasting, and often forecasting looks at different approaches Your data set is the demand*
excel please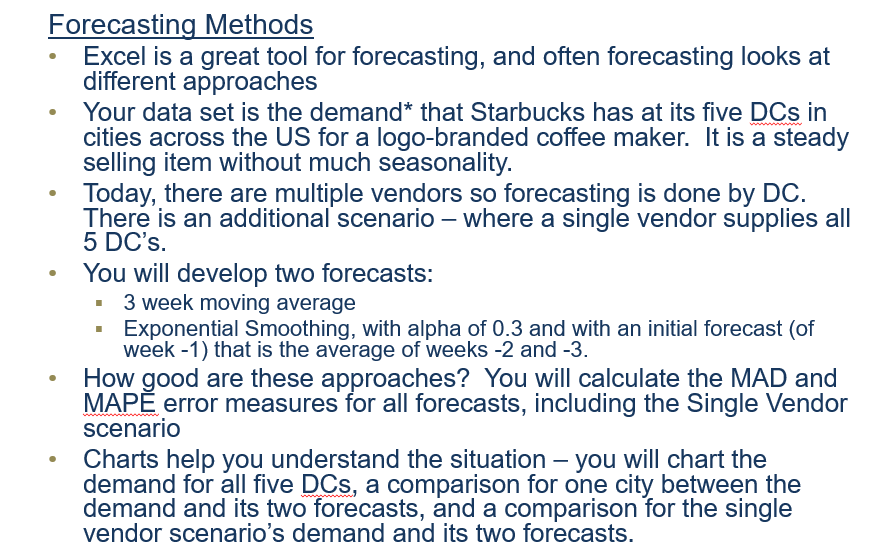
 undefined
Step by Step Solution
There are 3 Steps involved in it
1 Expert Approved Answer
Step: 1 Unlock

Question Has Been Solved by an Expert!
Get step-by-step solutions from verified subject matter experts
Step: 2 Unlock
Step: 3 Unlock