

Question: excel problem what kind of information? because this a problem from the book Problems Iwo Excel spreadsheets are provided on Connect for assistance in solving
excel problem 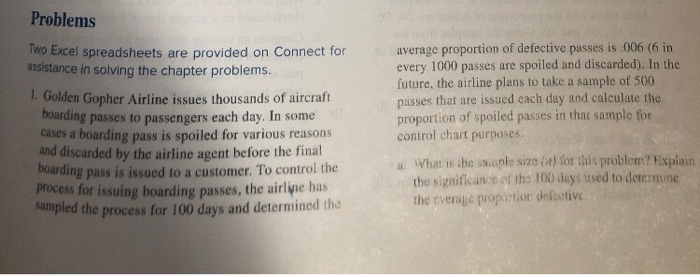
what kind of information? because this a problem from the book
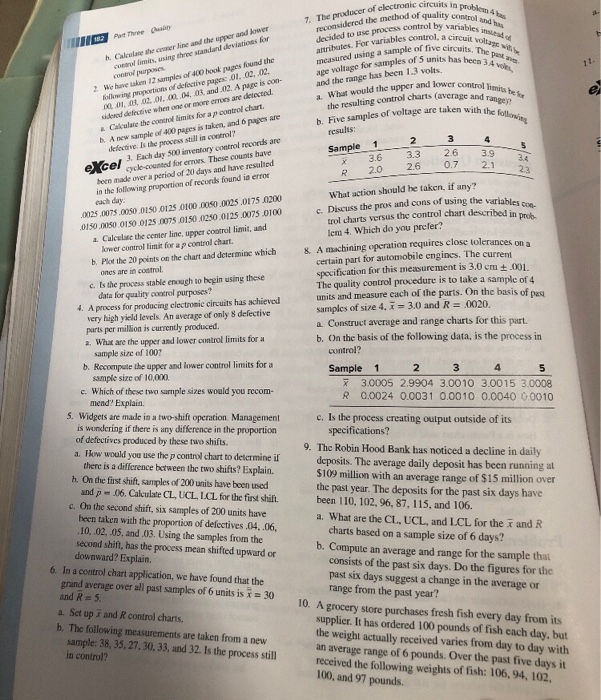
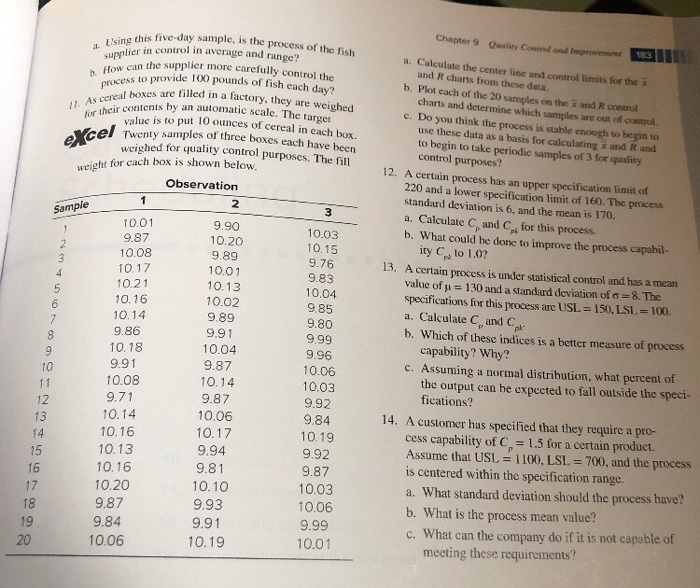
Problems Iwo Excel spreadsheets are provided on Connect for assistance in solving the chapter problems. 1. Golden Gopher Airline issues thousands of aircraft boarding passes to passengers each day. In some cases a boarding pass is spoiled for various reasons and discarded by the airline agent before the final boarding pass is issued to a customer. To control the process for issuing boarding passes, the airline has Sampled the process for 100 days and determined the average proportion of defective passes is .006 (6 in every 1000 passes are spoiled and discarded). In the future, the airline plans to take a sample of 500 passes that are issued each day and calculate the proportion of spoiled passes in that sample for control chart purposes What is the sample size (w) for this problem? Expiain the significance of the 100 days used to determine the average propertior defective weer of electronic circuits in prohi lity control and by variables in at s. The pak ben A vol 7. The producer of clectronic cinci sidered the method of quality decided to use process control by varis tributes. For variables control, a circuit w sured asing a sample of live circuits e voltage for samples of units has her and the range has been 1.3 volts. What would the upper and lower control the resulting control charts (average and h Five samples of voltage are taken with the results: Sample 1 trol unit be ad range 1602 at the City . Chwaetheroline and the upper and lower Limits, using three standard deviations for oppos 2. We have taken 12 samples of hack pupes found the p ortion of defective papes Or..02.02 LOLOL 02.0 2 .04. 03 and 12. Apipe is con- sed dictive when one or morem are detected Calculate the controllimits for a p rochart. A new sample of 400 pages is taken, and page are efective is the process still in control? e Y el. Each day 500 inventory control moods are per cycle-counted for ernes. These counts have been made over a period of 20 days and have resulted h the following R20 & in the following proportion of records found in error each day 00:25.0075.000.013001250100.0050.0025.01750200 0150.000.015001250075 0150412500125.0075.0100 2. Calculate the center linc, upper controllimit, and lower controllimit for a p control chart. b. Plot the 20 points on the chart and determine which oncs are in control c. Is the process stable enough to begin using these data for quality control purposes? 4. A process for producing electronic circuits has achieved very high yield levels. An average of only 8 defective parts per million is currently produced. 2. What are the upper and lower control limits for a sample size of 1007 b. Recompute the upper and lower control limits for a sample size of 10,000 What action should be taken, if any? Discuss the pros and cons of using the variables rol charts versus the control chat described in lem 4. Which do you prefer? A machining operation requires close tolerances on a certain part for automobile engines. The current specification for this measurement is 3.0 cm +.001. The quality control procedure is to take a sample of 4 units and measure each of the parts. On the basis of a Samples of size 4. i = 3.0 and R = .0020. a Construct average and range charts for this part. b. On the basis of the following data, is the process in control? Sample 1 2 3 4 5 x 3.0005 2.9904 3.0010 3.0015 3.0008 R 0.0024 0.0031 0.0010 0.0040 0,0010 c. Which of these two sample sizes would you recom- mend? Explain. 5. Widgets are made in a two-shift operation Management is wondering if there is any difference in the proportion of defectives produced by these two shifts. a. How would you use the p control chart to determine if there is a difference between the two shifts? Explain h. On the first shift, samples of 200 units have been used and p = 06. Calculate CL, UCLLCL for the first shift c. On the second shift, six samples of 200 units have been taken with the proportion of defectives .04 .06 .10.02. 05. and .03. Using the samples from the second shift, has the process mean shifted upward or downward? Explain. 6. In a control chart application, we have found that the grand average over all past samples of 6 units is 1 = 30 and R=5. a Set up I and R control charts. b. The following measurements are taken from a new sample: 38, 35, 27, 30, 33, and 32. Is the process still in control? c. Is the process creating output outside of its Specifications? 9. The Robin Hood Bank has noticed a decline in daily deposits. The average daily deposit has been running at $109 million with an average range of $15 million over the past year. The deposits for the past six days have been 110, 102, 96, 87, 115, and 106. a. What are the CL, UCL, and LCL for the 1 and R charts based on a sample size of 6 days? b. Compute an average and range for the sample that consists of the past six days. Do the figures for the past six days suggest a change in the average or range from the past year? 10. A grocery store purchases fresh fish every day from its supplier. It has ordered 100 pounds of fish each day, but the weight actually received varies from day to day with an average range of 6 pounds. Over the past five days it received the following weights of fish: 106, 94, 102, 100, and 97 pounds. 2. Using this fived Chapter 9 wality Control and Improvement 183 process to pa 11. As cereal boxe for their contents this five-day sample, is the process of the fish inplier in control in average and range? How can the supplier more carefully com ess to provide 100 pounds of fish each day? hoxes are filled in a factory, they are weighed vir contents by an automatic scale. The target value is to put 10 ounces of cereal in each box Veel Twenty samples of three boxes each have been wcighed for quality control purposes. The fill weight for each box is shown below Observation excel Sample 9.90 10.20 9.89 10.01 10.13 10.02 10.01 9.87 10.08 10.17 10.21 10.16 10.14 9.86 10.18 9.91 10.08 9.71 10.14 10.16 10.13 10.16 10.20 9.87 9.84 10.06 10.03 10.15 9.76 9.83 10.04 9.85 9.80 9.99 9.96 10.06 10.03 9.92 a. Calculate the center line and control limits for the and R charts from these data. b. Plot cach of the 20 samples on the and control charts and determine which samples are out of control. c. Do you think the process is stable enough to begin to use these data as a basis for calculating x and R and to begin to take periodic samples of 3 for quality control purposes? 12. A certain process has an upper specification limit of 220 and a lower specification limit of 160. The process standard deviation is 6, and the mean is 170. a. Calculate and for this process. b. What could be done to improve the process capabil- ity C to 1.0? A certain process is under statistical control and has a mean value of u = 130 and a standard deviation of = 8. The specifications for this process are USL = 150, LSL = 100. a. Calculate Cand Co b. Which of these indices is a better measure of process capability? Why? c. Assuming a normal distribution, what percent of the output can be expected to fall outside the speci- fications? 14. A customer has specified that they require a pro- cess capability of C = 1.5 for a certain product. Assume that USL = 1100, LSL = 700, and the process is centered within the specification range. a. What standard deviation should the process have? b. What is the process mean value? c. What can the company do if it is not capable of meeting these requirements? 9.84 9.89 9.91 10.04 9.87 10.14 9.87 10.06 10.17 9.94 9.81 10.10 9.93 9.91 10.19 10.19 9.92 9.87 10.03 10.06 9.99 10.01 20
Step by Step Solution
There are 3 Steps involved in it
1 Expert Approved Answer
Step: 1 Unlock

Question Has Been Solved by an Expert!
Get step-by-step solutions from verified subject matter experts
Step: 2 Unlock
Step: 3 Unlock