

Question: Excel Project: Part II Instructions Competitor #1 Income Statement (Tab 5), Competitor #1 Balance Sheet (Tab 6), Competitor #1 Cash Flows (Tab 7), Competitor #2
Excel Project: Part II Instructions
Competitor #1 Income Statement (Tab 5), Competitor #1 Balance Sheet (Tab 6), Competitor #1 Cash Flows (Tab 7), Competitor #2 Income Statement (Tab 8), Competitor #2 Balance Sheet (Tab 9), Competitor #2 Cash Flows (Tab 10), Historical and Competitor Ratios (Tab 11)
- Continue in the same Excel workbook prepared in Week 2, adding the following tabs:
- The 5th tab and 8th tabs in your Financial Statement Analysis Template must be labeled (Competitor Company Name) Income Statements. (Replace Competitor Company Name with the name of the competitor.)
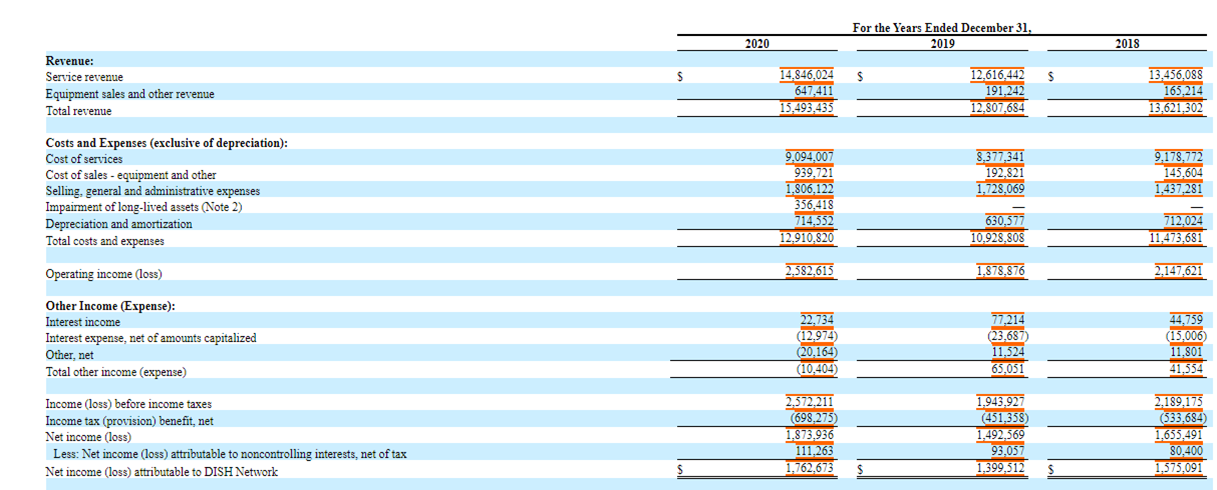
- Include the latest three years of income statements for your competitor based on SEC filings.
- Ensure that the worksheet includes a header with:
- Company Name
- Financial Statement Name (Income Statements)
- Financial Statement Dates
- Denomination level ($s in millions or thousands, etc.)
- The 6th and 9th tabs in your Financial Statement Analysis Template must be labeled (Competitor Company Name) Balance Sheets. (Replace Competitor Company Name with the name of the competitor.)
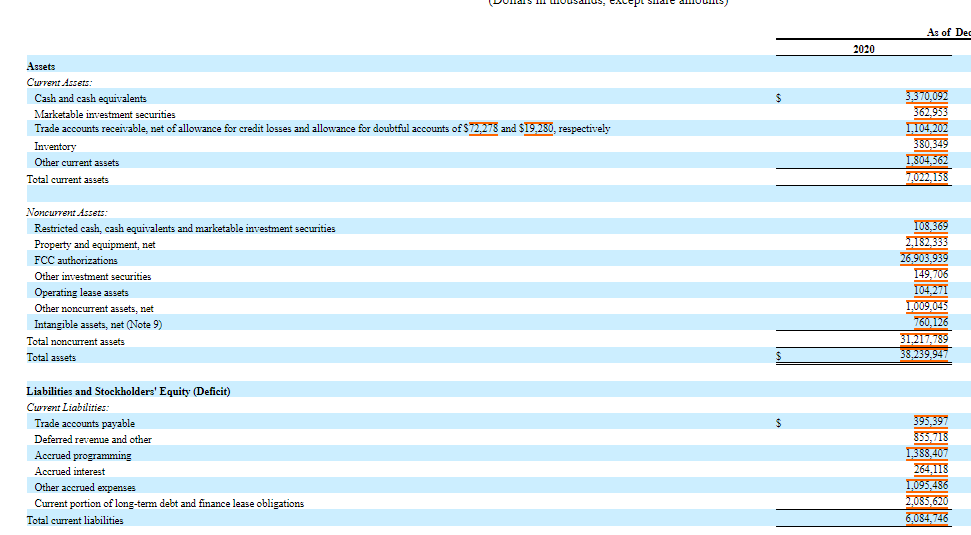
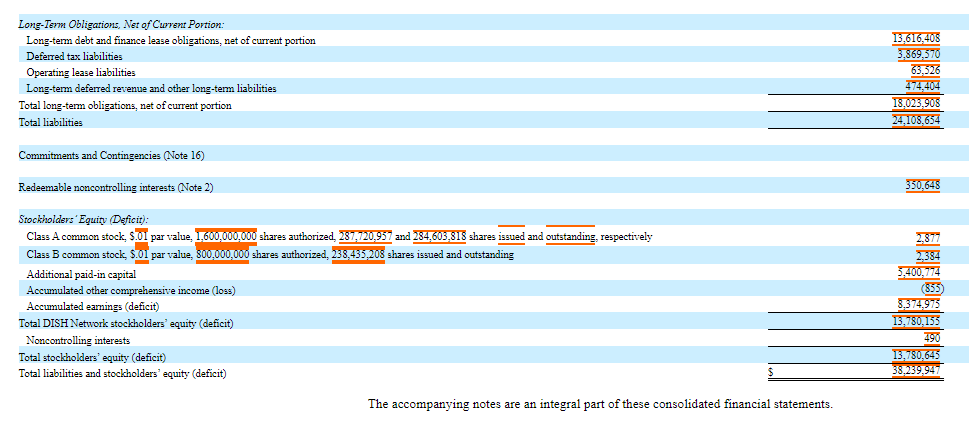
- Include the latest three years of balance sheets for your first competitor based on SEC (10-K) filings. (Note: Some 10-Ks only provided 2 years of balance sheet data. You may need to download the second most recent 10-K for your company in order to obtain 3 years of balance sheet data.)
- Ensure that the worksheet includes a header with:
- Company Name
- Financial Statement Name
- Financial Statement Dates
- Denomination level ($s in millions or thousands, etc.)
- The 7th and 10th tabs in your Financial Statement Analysis Template must be labeled (Competitor Company Name) Cash Flows. (Replace Competitor Company Name with the name of the competitor.)
- Include the latest three years based on SEC (10-K) filings.
- Make sure that the Income Statement, Balance Sheet, and Cash Flows Statement tie in as follows:
- Net Income from Income statement agrees with Net Income on the Statement of Cash Flows
- Ending Cash Balance from Statement of Cash Flows agrees with Cash in the Balance Sheet
- The 11th tab in your Financial Statement Analysis Template must be labeled Historical and Competitor Ratios
- The list of ratios to be included are as follows. They should be grouped under the headings, as shown:
- Liquidity Ratios
- Current Ratio
- Quick Ratio
- Leverage Ratios
- Debt to Total Assets Ratio
- Debt Equity Ratio
- Long-Term Debt to Equity
- Times Interest Earned Ratio
- Activity Ratios
- Inventory Turnover
- Fixed Assets Turnover
- Total Assets Turnover
- Accounts Receivable Turnover
- Average Collection Period
- Profitability Ratios
- Gross Profit Margin
- Operating Profit Margin
- Net Profit Margin
- Return on Total Assets (ROA)
- Return on Stockholders Equity (ROE)
- Earnings Per Share (EPS)
- Price Earnings Ratio
- Liquidity Ratios
- Calculate the ratios for your chosen company for the last three years, linking the ratio calculations back to the historical financial statement tabs (Tabs 2-4) using formulas.
- Calculate the ratios for each of your companys competitors (most recent year only), linking the ratio calculations to the competitor financial statements shown in Tabs 5-10 using formulas.
- Using the internet, locate the industry averages for the ratios listed above, and include them in the final column of the ratio tab. Include a footnote on the tab to identify the source of the industry averages.
- The list of ratios to be included are as follows. They should be grouped under the headings, as shown:
- Other instructions:
- The Excel workbook should be professionally formatted. Professional formatting includes:
- All numbers are formatted similarly. The use of decimals, commas for thousands, and other formatting is consistent.
- Dollar signs are included in the first and last numbers of each column.
- Subtotals and totals are preceded by a single underline. Totals are followed by a double underline.
- Line descriptions are indented/bolded in a manner that makes the spreadsheet easy to read.
- All totals and subtotals in the competitor financial statements as well as the ratio calculations should be calculated using formulas.
- The Excel workbook should be professionally formatted. Professional formatting includes:
- The 5th tab and 8th tabs in your Financial Statement Analysis Template must be labeled (Competitor Company Name) Income Statements. (Replace Competitor Company Name with the name of the competitor.)
EXHIBIT A: EXAMPLE HISTORICAL AND COMPETITOR RATIOS (TAB 11) 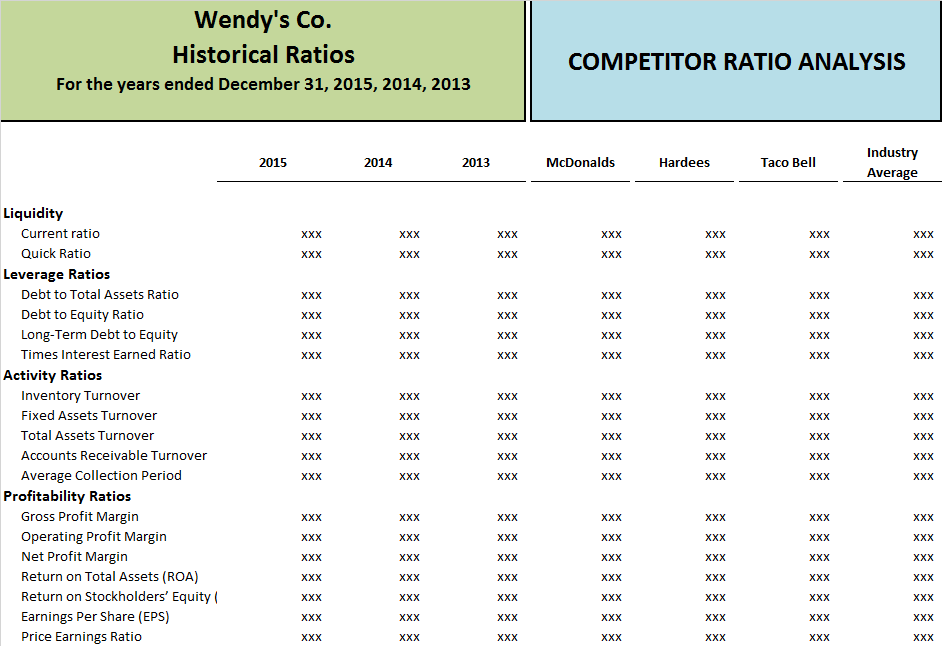
This is for Dish not wendy's
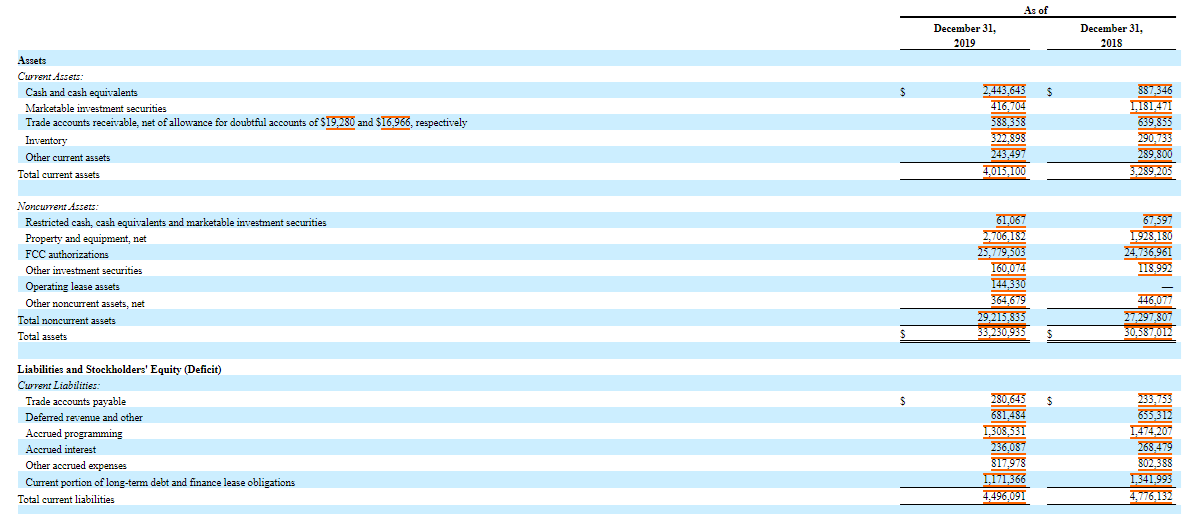

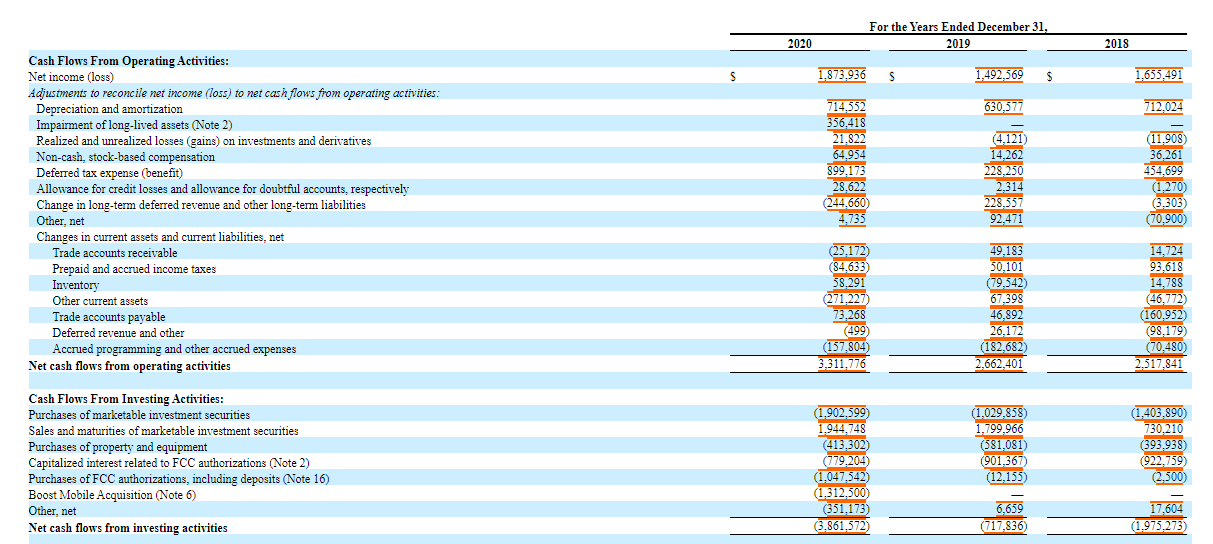
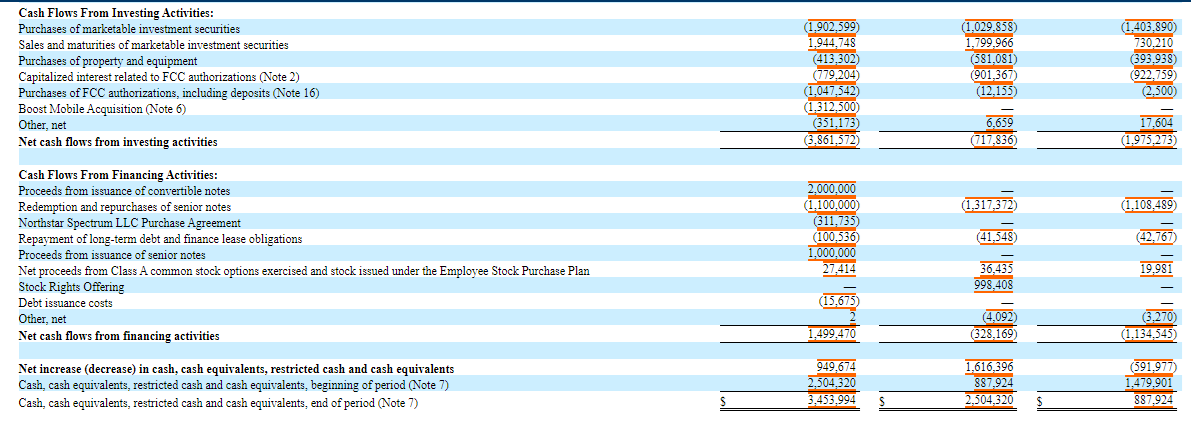
Wendy's Co. Historical Ratios For the years ended December 31, 2015, 2014, 2013 COMPETITOR RATIO ANALYSIS 2015 2014 2013 McDonalds Hardees Taco Bell Industry Average XXX XXX XXX XXX XXX XXX XXX XXX XXX XXX XXX XXX XXX XXX XXX XXX XXX XXX XXX XXX XXX XXX XXX XXX XXX XXX XXX XXX XXX XXX XXX XXX XXX XXX XXX XXX XXX XXX XXX XXX XXX XXX XXX XXX XXX XXX XXX XXX XXX XXX XXX XXX XXX XXX XXX XXX Liquidity Current ratio Quick Ratio Leverage Ratios Debt to Total Assets Ratio Debt to Equity Ratio Long-Term Debt to Equity Times Interest Earned Ratio Activity Ratios Inventory Turnover Fixed Assets Turnover Total Assets Turnover Accounts Receivable Turnover Average Collection Period Profitability Ratios Gross Profit Margin Operating Profit Margin Net Profit Margin Return on Total Assets (ROA) Return on Stockholders' Equity Earnings Per Share (EPS) Price Earnings Ratio XXX XXX XXX XXX XXX XXX XXX XXX XXX XXX XXX XXX XXX XXX XXX XXX XXX XXX XXX XXX XXX XXX XXX XXX XXX XXX XXX XXX XXX XXX XXX XXX XXX XXX XXX XXX XXX XXX XXX XXX XXX XXX XXX XXX XXX XXX XXX XXX XXX XXX XXX XXX XXX XXX XXX XXX XXX XXX XXX XXX XXX XXX XXX XXX XXX XXX XXX XXX XXX XXX For the Years Ended December 31, 2019 2020 2018 S $ Revenue: Service revenue Equipment sales and other revenue Total revenue 14,846,024 647,411 15,493,433 12,616,442 191,242 12,807,684 13,456,088 165,214 13,621,302 Costs and Expenses (exclusive of depreciation): Cost of services Cost of sales - equipment and other Selling, general and administrative expenses Impairment of long-lived assets (Note 2) Depreciation and amortization Total costs and expenses 8,377,341 192,821 1,728.069 9,178,772 145,604 1,437,281 9.094,007 939,721 1,806,122 356,418 714352 12.910.820 630,577 10.928,808 712,024 11,473,681 Operating income (loss) 2,582,613 1.878.876 2.147,621 Other Income (Expense): Interest income Interest expense, net of amounts capitalized Other, net Total other income (expense) 22.734 (12,974) (20.164) (10,404) 77.214 (23,687) 11,524 44.759 (15.006 11,801 41,554 65,051 Income (loss) before income taxes Income tax (provision) benefit, net Net income (los) Less: Net income (loss) attributable noncontrolling interests, net of tax Net income (loss) attributable to DISH Network 2,372,211 (698,273 1,873,936 111.263 1,762,678 1.943.927 (451,358 1,492,369 93,057 1,399,512 2,189,175 (533,684 1,635,491 80,400 1,575,091 As of Dec 2020 Assets Current Assets Cash and cash equivalents Marketable investment securities Trade accounts receivable, net of allowance for credit losses and allowance for doubtful accounts of $72,278 and $19,280, respectively $ 3.370,092 362953 1.104,202 380,349 1,804,562 7,022,158 Inventory Other current assets Total current assets 108,569 2.182355 Noncurrent Assets: Restricted cash, cash equivalents and marketable investment securities Property and equipment, net FCC authorizations Other investment securities Operating lease assets Other noncurrent assets, net Intangible assets, net (Note 9) Total noncurrent assets Total assets 26,905,939 TA 104,271 1.009.04 760,126 31.2174789 33.239.947 S Liabilities and Stockholders' Equity (Deficit) ) Cwret Liabilities: Trade accounts payable Deferred revenue and other Accrued programming Accrued interest Other accrued expenses Current portion of long-term debt and finance lease obligations Total current liabilities 395,397 855.718 1.388,407 264.118 1.095,486 2.085,620 6,084, 746 Long-Term Obligations, Net of Current Portion: Long-term debt and finance lease obligations, net of current portion Deferred tax liabilities Operating lease liabilities Long-term deferred revenue and other long-term liabilities Total long-term obligations, net of current portion Total liabilities 15,616,408 3,369,570 63,526 474 404 18.023905 24.108,654 Commitments and Contingencies (Note 16) Redeemable noncontrolling interests (Note 2) 350.648 Stockholders'Equity Deficit): Class A common stock 8.01 par value, 1.600.000.000 shares authorized, 237.720.957 and 284.605,313 shares issued and outstanding, respectively Class B common stock, 5.01 par value, 800,000,000 shares authorized, 238,455,208 shares issued and outstanding Additional paid-in capital Accumulated other comprehensive income (los) Accumulated earnings (deficit) Total DISH Network stockholders' equity (deficit) Noncontrolling interests Total stockholders' equity (deficit) Total liabilities and stockholders' equity (deficit) 2,877 2384 5,400,774 (855) 3374975 13,780,153 190 13,780,645 33.239,947 The accompanying notes are an integral part of these consolidated financial statements As of December 31, 2019 December 31, 2018 S S Assets Current Assets: Cash and cash equivalents Marketable investment securities Trade accounts receivable, net of allowance for doubtful accounts of $19.280 and $16,966, respectively Inventory Other current assets Total current assets 2,443,645 416,704 583.358 322,898 243,497 4,015.100 887,346 1,181,471 639,355 290,735 289,800 3.289.205 Noncurrent Assets: Restricted cash, cash equivalents and marketable investment securities Property and equipment, net FCC authorizations Other investment securities Operating lease assets Other noncurrent assets, net Total noncurrent assets Total assets 67,597 1.928,180 24,736,961 118.992 61.067 2,706,182 25,779,505 160,074 144.330 364,679 29.213,835 35,250,935 446.077 27.297.807 30,587,012 S $ Liabilities and Stockholders' Equity (Deficit) Current Liabilities: Trade accounts payable Deferred revenue and other Accrued programming Accrued interest Other accrued expenses Current portion of long-term debt and finance lease obligations Total current liabilities 280.645 681.484 13303,551 236,087 $17.978 1,171.366 4496.091 233,753 655.312 1.474.207 268,479 802.388 1.341,993 4,776,132 15.810,784 2,474,90 Long-Term Obligations, Net of Current Portion: Long-term debt and finance lease obligations, net of current portion Deferred tax liabilities Operating lease liabilities Long-term deferred revenue and other long-term liabilities Total long-term obligations, net of current portion Total liabilities 12.968.279 2.870.655 84.795 695.013 16,618.697 21,114,788 470,932 16.756,623 21,532,755 Commitments and Contingencies (Note 15) Redeemable noncontrolling interests (Note 2) 552.073 460,068 2.295 Stockholders' Equity Deficit): Class A common stock 8.01 par value, 1.600.000.000 shares authorized 234,605,818 and 229,448,857 shares issued and outstanding, respectively Class B common stock 8.01 par value, 300.000.000 shares authorized, 238,432203 shares issued and outstanding Additional paid-in capital Accumulated other comprehensive income (loss) Accumulated earnings (deficit) Total DISH Network stockholders' equity (deficit) Noncontrolling interests Total stockholders' equity (deficit) Total liabilities and stockholders' equity (deficit) 2,846 2384 4.947.007 (18) 6,612 302 11,564,521 (449) 11,564,072 35.230.935 27354 3.379,093 (874) 51212,790 8595,688 (1,499) 8,594.189 30,387,012 For the Years Ended December 31, 2019 2020 2018 S 1,873.936 S 1,492,569 $ 1,655,491 630,577 712,024 (11.908 714,552 356,418 21.822 64.954 899,173 28.622 (244,660 4.733 (4.121) 14.262 228.250 2.314 36,261 454,699 (1.270) 3,303) Cash Flows From Operating Activities: Net income (loss) Adjustments to reconcile net income (loss) to net cash flows from operating activities: Depreciation and amortization Impairment of long-lived assets (Note 2) Realized and unrealized losses (gains) on investments and derivatives Non-cash, stock-based compensation Deferred tax expense (benefit) Allowance for credit losses and allowance for doubtful accounts, respectively Change in long-term deferred revenue and other long-term liabilities Other, net in current assets and current liabilities, net Trade accounts receivable Prepaid and accrued income taxes Inventory Other current assets Trade accounts payable Deferred revenue and other Accrued programming and other accrued expenses Net cash flows from operating activities 228,537 92,471 (70,900) Change 14,724 (25.172) (84.633) 58.291 (271,227) 73,268 (499 49,183 30.101 (79,542) 67,398 46,892 26.172 (182.682) 2,662,401 93,618 14.788 (46.772) (160.952) (98.179) (70.480) 2.317.841 (157.804 3,311,776 Cash Flows From Investing Activities: Purchases of marketable investment securities Sales and maturities of marketable investment securities Purchases of property and equipment Capitalized interest ted to FCC authorizations (Note 2) Purchases of FCC authorizations, including deposits (Note 16) Boost Mobile Acquisition (Note 6) Other, net Net cash flows from investing activities (1,902,599) 1,944,745 (413,302) (779,204) (1.047.542) (1,312,500 (351,178 (3.861,572) (1,029,858) 1,799,966 (581,081) (901,367) (12,155) (1,403,890) 730,210 (393,938) (922.739) (2,500 17.604 6,659 (717.836) (1.975.273) Cash Flows From Investing Activities: Purchases of marketable investment securities Sales and maturities of marketable investment securities Purchases of property and equipment Capitalized interest related to FCC authorizations (Note 2) Purchases of FCC authorizations, including deposits (Note 16) Boost Mobile Acquisition (Note 6) Other, net Net cash flows from investing activities (1.403.890 730,210 (393,938) (1,029,858 1,799,966 (581,081) (901,367) (12,155) (1,902.599 1.944,748 (413,302 792043 (1,047,542 (1.312,500) 351,173) 3.861,572) 922,759 (2.500) 6,659 (717,836 17,604 (1.975.273) (1.317,372 (1.108,489) 2.000.000 (1.100.000 (311,735 (100,536 1,000,000 27,414 (41,548 Cash Flows From Financing Activities: Proceeds from issuance of convertible notes Redemption and repurchases of senior notes Northstar Spectrum LLC Purchase Agreement Repayment of long-term debt and finance lease obligations Proceeds from issuance of senior notes Net proceeds from Class A common stock options exercised and stock issued under the Employee Stock Purchase Plan Stock Rights Offering Debt Other, net Net cash flows from financing activities (42,767 19.981 36.435 998,408 issuance costs (15,675 (4,092) (328,169) (3.270 (1.134,545) 1,499,470 Net increase (decrease) in cash, cash equivalents, restricted cash and cash equivalents Cash, cash equivalents, restricted cash and cash equivalents, beginning of period (Note 7) Cash, cash equivalents, restricted cash and cash equivalents, end of period (Note 7) 949,674 2.504.320 3.453.994 1,616.396 887,924 2,504,320 (591,977) 1.479,901 887.924 Wendy's Co. Historical Ratios For the years ended December 31, 2015, 2014, 2013 COMPETITOR RATIO ANALYSIS 2015 2014 2013 McDonalds Hardees Taco Bell Industry Average XXX XXX XXX XXX XXX XXX XXX XXX XXX XXX XXX XXX XXX XXX XXX XXX XXX XXX XXX XXX XXX XXX XXX XXX XXX XXX XXX XXX XXX XXX XXX XXX XXX XXX XXX XXX XXX XXX XXX XXX XXX XXX XXX XXX XXX XXX XXX XXX XXX XXX XXX XXX XXX XXX XXX XXX Liquidity Current ratio Quick Ratio Leverage Ratios Debt to Total Assets Ratio Debt to Equity Ratio Long-Term Debt to Equity Times Interest Earned Ratio Activity Ratios Inventory Turnover Fixed Assets Turnover Total Assets Turnover Accounts Receivable Turnover Average Collection Period Profitability Ratios Gross Profit Margin Operating Profit Margin Net Profit Margin Return on Total Assets (ROA) Return on Stockholders' Equity Earnings Per Share (EPS) Price Earnings Ratio XXX XXX XXX XXX XXX XXX XXX XXX XXX XXX XXX XXX XXX XXX XXX XXX XXX XXX XXX XXX XXX XXX XXX XXX XXX XXX XXX XXX XXX XXX XXX XXX XXX XXX XXX XXX XXX XXX XXX XXX XXX XXX XXX XXX XXX XXX XXX XXX XXX XXX XXX XXX XXX XXX XXX XXX XXX XXX XXX XXX XXX XXX XXX XXX XXX XXX XXX XXX XXX XXX For the Years Ended December 31, 2019 2020 2018 S $ Revenue: Service revenue Equipment sales and other revenue Total revenue 14,846,024 647,411 15,493,433 12,616,442 191,242 12,807,684 13,456,088 165,214 13,621,302 Costs and Expenses (exclusive of depreciation): Cost of services Cost of sales - equipment and other Selling, general and administrative expenses Impairment of long-lived assets (Note 2) Depreciation and amortization Total costs and expenses 8,377,341 192,821 1,728.069 9,178,772 145,604 1,437,281 9.094,007 939,721 1,806,122 356,418 714352 12.910.820 630,577 10.928,808 712,024 11,473,681 Operating income (loss) 2,582,613 1.878.876 2.147,621 Other Income (Expense): Interest income Interest expense, net of amounts capitalized Other, net Total other income (expense) 22.734 (12,974) (20.164) (10,404) 77.214 (23,687) 11,524 44.759 (15.006 11,801 41,554 65,051 Income (loss) before income taxes Income tax (provision) benefit, net Net income (los) Less: Net income (loss) attributable noncontrolling interests, net of tax Net income (loss) attributable to DISH Network 2,372,211 (698,273 1,873,936 111.263 1,762,678 1.943.927 (451,358 1,492,369 93,057 1,399,512 2,189,175 (533,684 1,635,491 80,400 1,575,091 As of Dec 2020 Assets Current Assets Cash and cash equivalents Marketable investment securities Trade accounts receivable, net of allowance for credit losses and allowance for doubtful accounts of $72,278 and $19,280, respectively $ 3.370,092 362953 1.104,202 380,349 1,804,562 7,022,158 Inventory Other current assets Total current assets 108,569 2.182355 Noncurrent Assets: Restricted cash, cash equivalents and marketable investment securities Property and equipment, net FCC authorizations Other investment securities Operating lease assets Other noncurrent assets, net Intangible assets, net (Note 9) Total noncurrent assets Total assets 26,905,939 TA 104,271 1.009.04 760,126 31.2174789 33.239.947 S Liabilities and Stockholders' Equity (Deficit) ) Cwret Liabilities: Trade accounts payable Deferred revenue and other Accrued programming Accrued interest Other accrued expenses Current portion of long-term debt and finance lease obligations Total current liabilities 395,397 855.718 1.388,407 264.118 1.095,486 2.085,620 6,084, 746 Long-Term Obligations, Net of Current Portion: Long-term debt and finance lease obligations, net of current portion Deferred tax liabilities Operating lease liabilities Long-term deferred revenue and other long-term liabilities Total long-term obligations, net of current portion Total liabilities 15,616,408 3,369,570 63,526 474 404 18.023905 24.108,654 Commitments and Contingencies (Note 16) Redeemable noncontrolling interests (Note 2) 350.648 Stockholders'Equity Deficit): Class A common stock 8.01 par value, 1.600.000.000 shares authorized, 237.720.957 and 284.605,313 shares issued and outstanding, respectively Class B common stock, 5.01 par value, 800,000,000 shares authorized, 238,455,208 shares issued and outstanding Additional paid-in capital Accumulated other comprehensive income (los) Accumulated earnings (deficit) Total DISH Network stockholders' equity (deficit) Noncontrolling interests Total stockholders' equity (deficit) Total liabilities and stockholders' equity (deficit) 2,877 2384 5,400,774 (855) 3374975 13,780,153 190 13,780,645 33.239,947 The accompanying notes are an integral part of these consolidated financial statements As of December 31, 2019 December 31, 2018 S S Assets Current Assets: Cash and cash equivalents Marketable investment securities Trade accounts receivable, net of allowance for doubtful accounts of $19.280 and $16,966, respectively Inventory Other current assets Total current assets 2,443,645 416,704 583.358 322,898 243,497 4,015.100 887,346 1,181,471 639,355 290,735 289,800 3.289.205 Noncurrent Assets: Restricted cash, cash equivalents and marketable investment securities Property and equipment, net FCC authorizations Other investment securities Operating lease assets Other noncurrent assets, net Total noncurrent assets Total assets 67,597 1.928,180 24,736,961 118.992 61.067 2,706,182 25,779,505 160,074 144.330 364,679 29.213,835 35,250,935 446.077 27.297.807 30,587,012 S $ Liabilities and Stockholders' Equity (Deficit) Current Liabilities: Trade accounts payable Deferred revenue and other Accrued programming Accrued interest Other accrued expenses Current portion of long-term debt and finance lease obligations Total current liabilities 280.645 681.484 13303,551 236,087 $17.978 1,171.366 4496.091 233,753 655.312 1.474.207 268,479 802.388 1.341,993 4,776,132 15.810,784 2,474,90 Long-Term Obligations, Net of Current Portion: Long-term debt and finance lease obligations, net of current portion Deferred tax liabilities Operating lease liabilities Long-term deferred revenue and other long-term liabilities Total long-term obligations, net of current portion Total liabilities 12.968.279 2.870.655 84.795 695.013 16,618.697 21,114,788 470,932 16.756,623 21,532,755 Commitments and Contingencies (Note 15) Redeemable noncontrolling interests (Note 2) 552.073 460,068 2.295 Stockholders' Equity Deficit): Class A common stock 8.01 par value, 1.600.000.000 shares authorized 234,605,818 and 229,448,857 shares issued and outstanding, respectively Class B common stock 8.01 par value, 300.000.000 shares authorized, 238,432203 shares issued and outstanding Additional paid-in capital Accumulated other comprehensive income (loss) Accumulated earnings (deficit) Total DISH Network stockholders' equity (deficit) Noncontrolling interests Total stockholders' equity (deficit) Total liabilities and stockholders' equity (deficit) 2,846 2384 4.947.007 (18) 6,612 302 11,564,521 (449) 11,564,072 35.230.935 27354 3.379,093 (874) 51212,790 8595,688 (1,499) 8,594.189 30,387,012 For the Years Ended December 31, 2019 2020 2018 S 1,873.936 S 1,492,569 $ 1,655,491 630,577 712,024 (11.908 714,552 356,418 21.822 64.954 899,173 28.622 (244,660 4.733 (4.121) 14.262 228.250 2.314 36,261 454,699 (1.270) 3,303) Cash Flows From Operating Activities: Net income (loss) Adjustments to reconcile net income (loss) to net cash flows from operating activities: Depreciation and amortization Impairment of long-lived assets (Note 2) Realized and unrealized losses (gains) on investments and derivatives Non-cash, stock-based compensation Deferred tax expense (benefit) Allowance for credit losses and allowance for doubtful accounts, respectively Change in long-term deferred revenue and other long-term liabilities Other, net in current assets and current liabilities, net Trade accounts receivable Prepaid and accrued income taxes Inventory Other current assets Trade accounts payable Deferred revenue and other Accrued programming and other accrued expenses Net cash flows from operating activities 228,537 92,471 (70,900) Change 14,724 (25.172) (84.633) 58.291 (271,227) 73,268 (499 49,183 30.101 (79,542) 67,398 46,892 26.172 (182.682) 2,662,401 93,618 14.788 (46.772) (160.952) (98.179) (70.480) 2.317.841 (157.804 3,311,776 Cash Flows From Investing Activities: Purchases of marketable investment securities Sales and maturities of marketable investment securities Purchases of property and equipment Capitalized interest ted to FCC authorizations (Note 2) Purchases of FCC authorizations, including deposits (Note 16) Boost Mobile Acquisition (Note 6) Other, net Net cash flows from investing activities (1,902,599) 1,944,745 (413,302) (779,204) (1.047.542) (1,312,500 (351,178 (3.861,572) (1,029,858) 1,799,966 (581,081) (901,367) (12,155) (1,403,890) 730,210 (393,938) (922.739) (2,500 17.604 6,659 (717.836) (1.975.273) Cash Flows From Investing Activities: Purchases of marketable investment securities Sales and maturities of marketable investment securities Purchases of property and equipment Capitalized interest related to FCC authorizations (Note 2) Purchases of FCC authorizations, including deposits (Note 16) Boost Mobile Acquisition (Note 6) Other, net Net cash flows from investing activities (1.403.890 730,210 (393,938) (1,029,858 1,799,966 (581,081) (901,367) (12,155) (1,902.599 1.944,748 (413,302 792043 (1,047,542 (1.312,500) 351,173) 3.861,572) 922,759 (2.500) 6,659 (717,836 17,604 (1.975.273) (1.317,372 (1.108,489) 2.000.000 (1.100.000 (311,735 (100,536 1,000,000 27,414 (41,548 Cash Flows From Financing Activities: Proceeds from issuance of convertible notes Redemption and repurchases of senior notes Northstar Spectrum LLC Purchase Agreement Repayment of long-term debt and finance lease obligations Proceeds from issuance of senior notes Net proceeds from Class A common stock options exercised and stock issued under the Employee Stock Purchase Plan Stock Rights Offering Debt Other, net Net cash flows from financing activities (42,767 19.981 36.435 998,408 issuance costs (15,675 (4,092) (328,169) (3.270 (1.134,545) 1,499,470 Net increase (decrease) in cash, cash equivalents, restricted cash and cash equivalents Cash, cash equivalents, restricted cash and cash equivalents, beginning of period (Note 7) Cash, cash equivalents, restricted cash and cash equivalents, end of period (Note 7) 949,674 2.504.320 3.453.994 1,616.396 887,924 2,504,320 (591,977) 1.479,901 887.924
Step by Step Solution
There are 3 Steps involved in it

Get step-by-step solutions from verified subject matter experts