

Question: Excel Project: Well-Designed Visualizations The following visualization (viz) shows all state taxes and fees collected for the state of New York from 2014 to 2018,
Excel Project: Well-Designed Visualizations The following visualization (viz) shows all state taxes and fees collected for the state of New York from 2014 to 2018, inclusive.
REQUIRED
For this viz, do the following: Describe ways you would change the viz to (a) simplify the data presentation and (b) properly emphasize the objective of the stakeholder. Assume the objective of the stakeholder of this viz is to compare how each type of tax collection changes over time.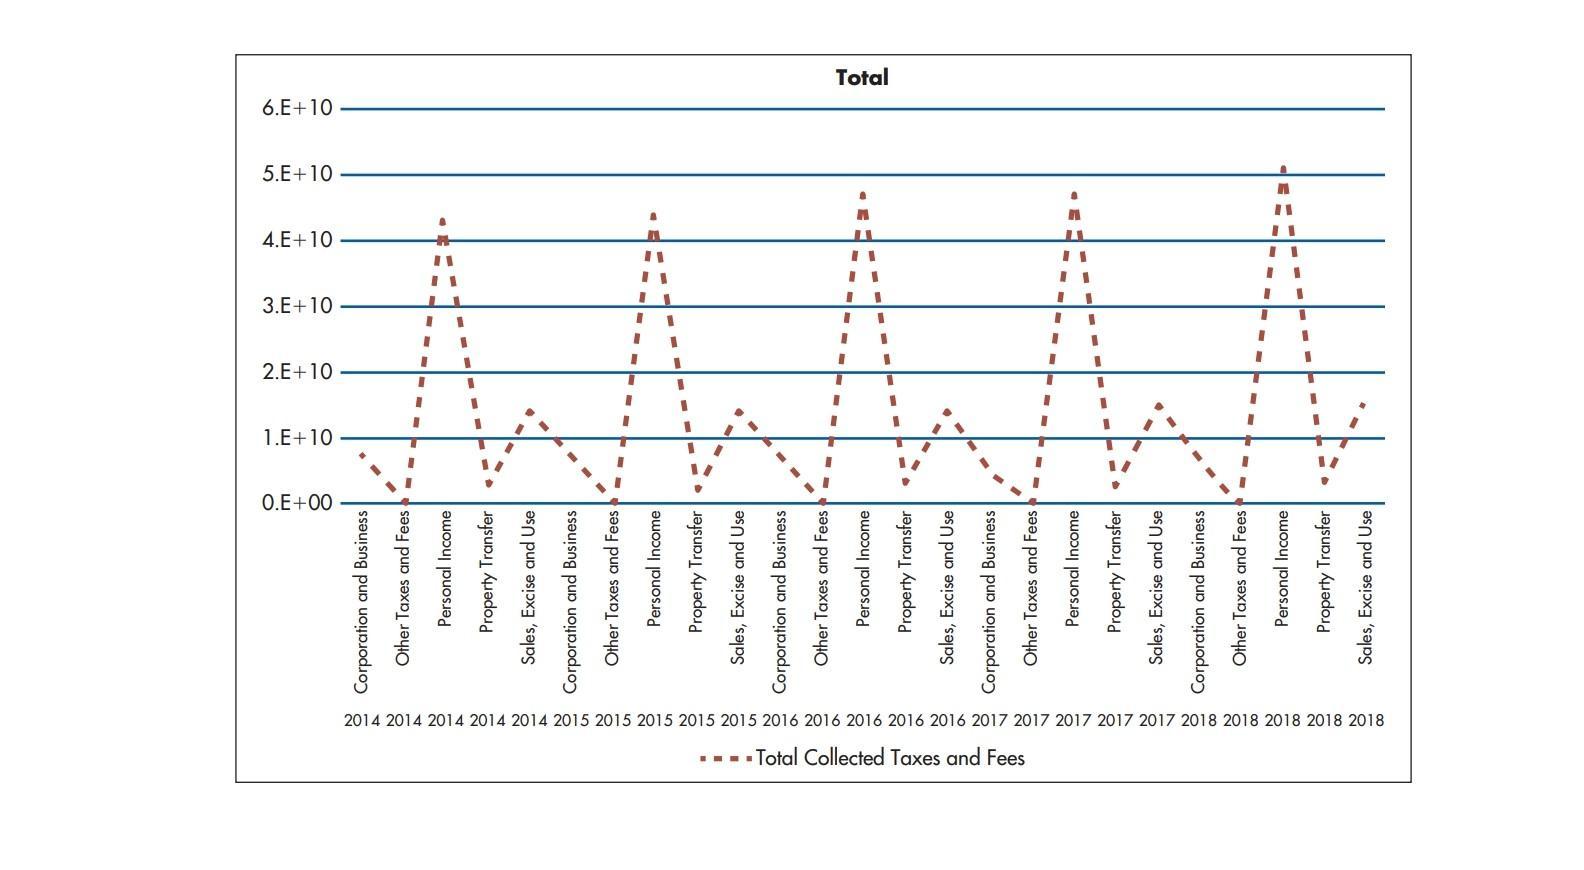
2014 2014 2014 2014 2014 2015 2015 2015 2015 2015 2016 Total Collected Taxes and Fees 2016 2016 2016 2016 2017 2017 2017 2017 2017 2018 2018 2018 2018 2018 Corporation and Business Other Taxes and Fees Personal Income Property Transfer Sales, Excise and Use Corporation and Business Other Taxes and Fees Personal Income Property Transfer Sales, Excise and Use and Business Other Taxes and Fees Personal Corporation Property Sales, Excise and Use and Business Corporation 0.E+00 Income Transfer Corporation Other Taxes and Fees Personal Income Property Transfer Sales, Excise and Use and Business Other Taxes and Fees Personal Income Property Transfer Sales, Excise and Use 1.E+10 I 2.E+10 3.E+10 L 4.E+10 2 5.E+10 6.E+10 Total
Step by Step Solution
3.47 Rating (157 Votes )
There are 3 Steps involved in it
The above visualization can be easily represented through cluster bar graph in order to properly ... View full answer

Get step-by-step solutions from verified subject matter experts