

Question: Excel sheet with required info is pasted below questions: The Modelling worksheet contains assumptions to build an Income Statement forecast for Chalten Ltd for the
Excel sheet with required info is pasted below questions:
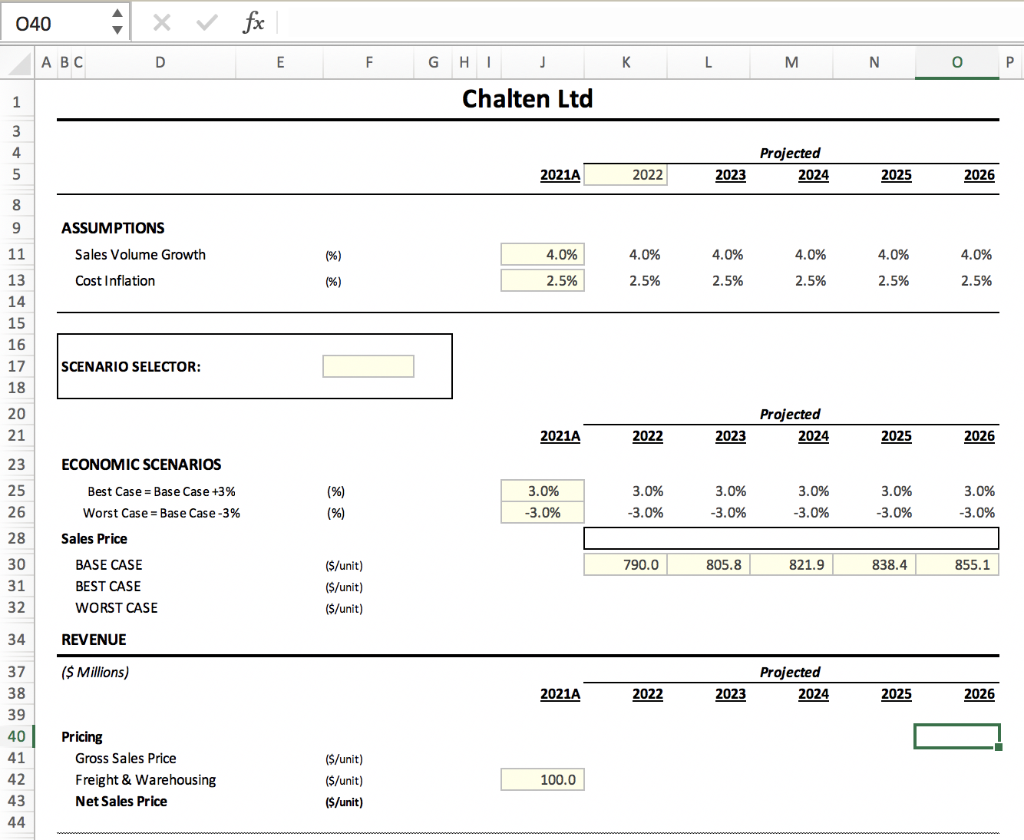
The Modelling worksheet contains assumptions to build an Income Statement forecast for Chalten Ltd for the 2022 2026 period. Using the assumptions provided, please:
-
[2 marks] Build the Economic scenarios section [Rows 16 -33], including a scenario selector
-
[2 marks] Build the Revenue forecast [Rows 42 -58]
-
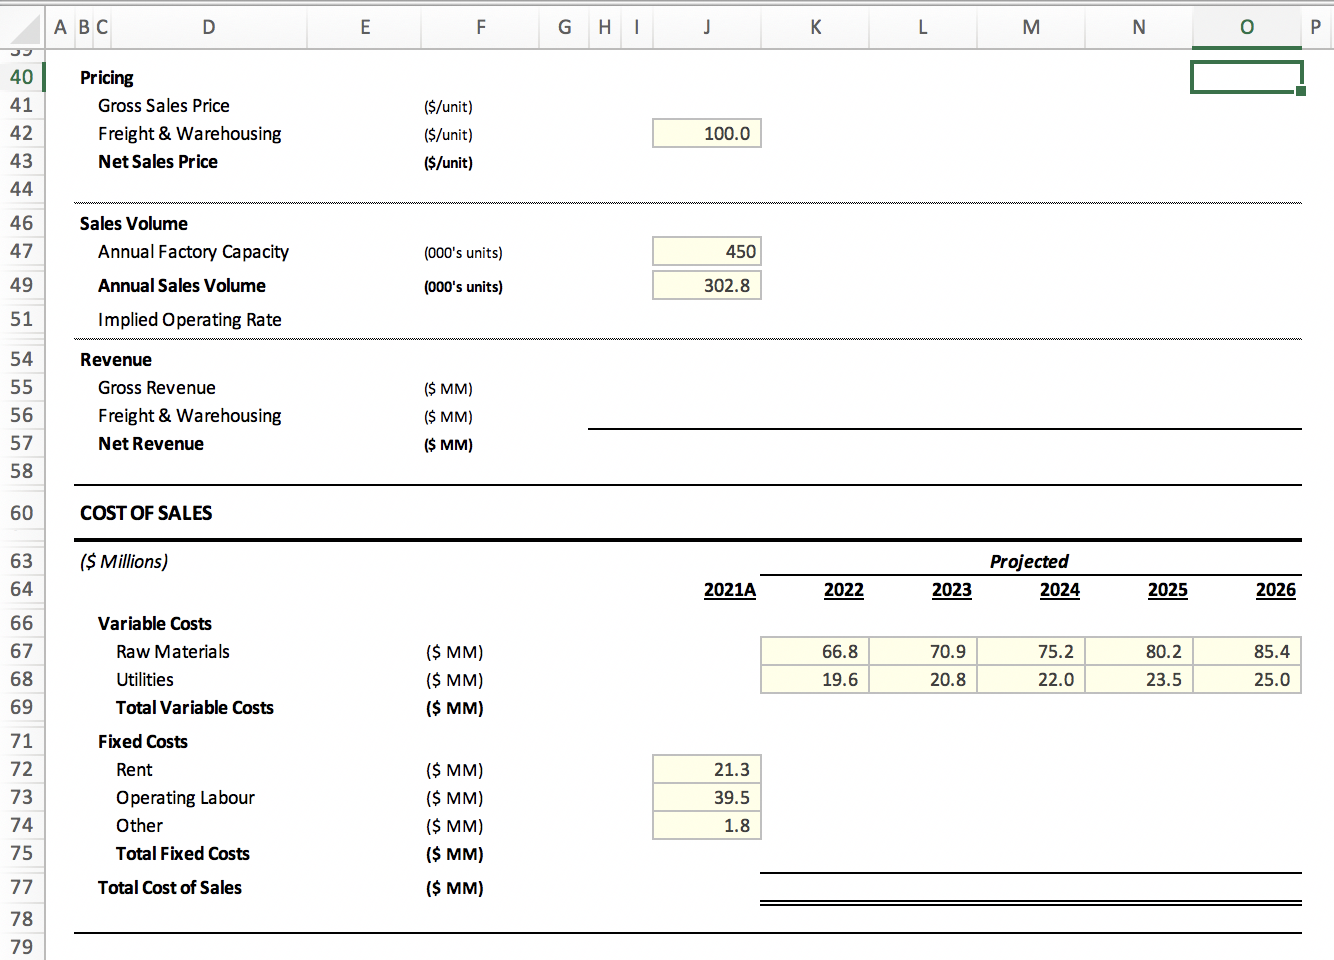
[2 marks] Build the Cost of Sales forecast [Rows 68 -78]
-
[2 marks] Build the Income Statement forecast [Rows 88 -96]
-
[6 marks] After analysing the companys forecasts, Chaltens CFO believes the sales volume growth is too high. The company aims to having an implied operating rate that does not exceed 80%. Given that the sales growth rate is the same every year, what should that rate be to make sure Chalten followsthe 80% rule?
-
[6 marks] The model is also assessed for consistency and use of best practices
![the 2022 2026 period. Using the assumptions provided, please: [2 marks] Build](https://dsd5zvtm8ll6.cloudfront.net/si.experts.images/questions/2024/10/66ff7a94d35cb_09266ff7a941f02b.jpg)
040 fx ABC D E F G HI j K L M N 0 1 Chalten Ltd 3 4 Projected 2024 5 2021A 2022 2023 2025 2026 8 9 ASSUMPTIONS Sales Volume Growth (%) 4.0% 4.0% 4.0% 4.0% 4.0% 4.0% Cost Inflation (%) 2.5% 2.5% 2.5% 2.5% 2.5% 2.5% 11 13 14 15 16 17 18 SCENARIO SELECTOR: 20 21 Projected 2024 2021A 2022 2023 2025 2026 23 ECONOMIC SCENARIOS 25 26 Best Case=Base Case +3% Worst Case=Base Case -3% (%) (%) 3.0% -3.0% 3.0% -3.0% 3.0% -3.0% 3.0% -3.0% 3.0% -3.0% 3.0% -3.0% 28 Sales Price 790.0 805.8 821.9 838.4 855.1 30 31 32 BASE CASE BEST CASE WORST CASE ($/unit) ($/unit) ($/unit) 34 REVENUE ($ Millions) Projected 2024 2021A 2022 2023 2025 2026 37 38 39 40 41 42 43 44 Pricing Gross Sales Price Freight & Warehousing Net Sales Price ($/unit) ($/unit) ($/unit) 100.0 A B C D E F G H H J L 3 N o P 40 41 Pricing Gross Sales Price Freight & Warehousing Net Sales Price ($/unit) ($/unit) ($/unit) 42 43 44 100.0 46 47 Sales Volume Annual Factory Capacity Annual Sales Volume (000's units) 450 49 (000's units) 302.8 51 Implied Operating Rate 54 55 56 57 58 Revenue Gross Revenue Freight & Warehousing Net Revenue ($ MM) ($ MM) ($ MM) 60 COST OF SALES ($ Millions) Projected 2024 64 2021A 2022 2023 2025 2026 66 67 68 69 Variable Costs Raw Materials Utilities Total Variable Costs ($ MM) ($ MM) ($ MM) 66.8 19.6 70.9 20.8 75.2 22.0 80.2 23.5 85.4 25.0 B 8GB9nzB9 71 72 73 74 75 Fixed Costs Rent Operating Labour Other Total Fixed Costs ($ MM) ($ MM) ($ MM) ($ MM) ($ MM) 21.3 39.5 1.8 77 Total Cost of Sales 78 79 79 80 INCOME STATEMENT ($ Millions) Projected 2024 2021A 2022 2023 2025 2026 82 83 84 85 86 87 88 89 Revenue Gross Revenue Freight & Warehousing Net Revenue 90 Cost of Sales SG&A 3.8 Total Costs 91 92 93 94 95 96 97 98 EBITDA 040 fx ABC D E F G HI j K L M N 0 1 Chalten Ltd 3 4 Projected 2024 5 2021A 2022 2023 2025 2026 8 9 ASSUMPTIONS Sales Volume Growth (%) 4.0% 4.0% 4.0% 4.0% 4.0% 4.0% Cost Inflation (%) 2.5% 2.5% 2.5% 2.5% 2.5% 2.5% 11 13 14 15 16 17 18 SCENARIO SELECTOR: 20 21 Projected 2024 2021A 2022 2023 2025 2026 23 ECONOMIC SCENARIOS 25 26 Best Case=Base Case +3% Worst Case=Base Case -3% (%) (%) 3.0% -3.0% 3.0% -3.0% 3.0% -3.0% 3.0% -3.0% 3.0% -3.0% 3.0% -3.0% 28 Sales Price 790.0 805.8 821.9 838.4 855.1 30 31 32 BASE CASE BEST CASE WORST CASE ($/unit) ($/unit) ($/unit) 34 REVENUE ($ Millions) Projected 2024 2021A 2022 2023 2025 2026 37 38 39 40 41 42 43 44 Pricing Gross Sales Price Freight & Warehousing Net Sales Price ($/unit) ($/unit) ($/unit) 100.0 A B C D E F G H H J L 3 N o P 40 41 Pricing Gross Sales Price Freight & Warehousing Net Sales Price ($/unit) ($/unit) ($/unit) 42 43 44 100.0 46 47 Sales Volume Annual Factory Capacity Annual Sales Volume (000's units) 450 49 (000's units) 302.8 51 Implied Operating Rate 54 55 56 57 58 Revenue Gross Revenue Freight & Warehousing Net Revenue ($ MM) ($ MM) ($ MM) 60 COST OF SALES ($ Millions) Projected 2024 64 2021A 2022 2023 2025 2026 66 67 68 69 Variable Costs Raw Materials Utilities Total Variable Costs ($ MM) ($ MM) ($ MM) 66.8 19.6 70.9 20.8 75.2 22.0 80.2 23.5 85.4 25.0 B 8GB9nzB9 71 72 73 74 75 Fixed Costs Rent Operating Labour Other Total Fixed Costs ($ MM) ($ MM) ($ MM) ($ MM) ($ MM) 21.3 39.5 1.8 77 Total Cost of Sales 78 79 79 80 INCOME STATEMENT ($ Millions) Projected 2024 2021A 2022 2023 2025 2026 82 83 84 85 86 87 88 89 Revenue Gross Revenue Freight & Warehousing Net Revenue 90 Cost of Sales SG&A 3.8 Total Costs 91 92 93 94 95 96 97 98 EBITDA
Step by Step Solution
There are 3 Steps involved in it

Get step-by-step solutions from verified subject matter experts