

Question: Excel Skills Demonstration * x A 1 1 2 3 4 5 6 7 8 9 10 11 12 13 14 15 16 17 18
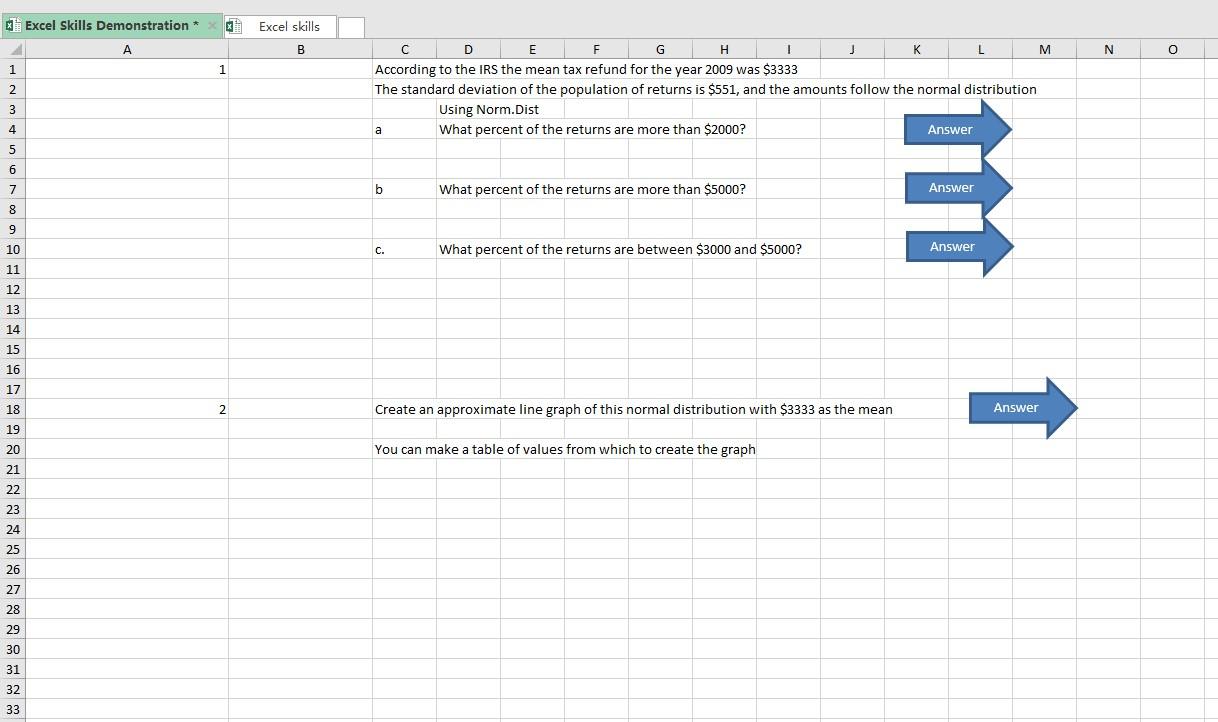
Excel Skills Demonstration * x A 1 1 2 3 4 5 6 7 8 9 10 11 12 13 14 15 16 17 18 19 20 21 22 23 24 25 26 27 28 29 30 31 32 33 2 Excel skills B D E F G H T J K L M According to the IRS the mean tax refund for the year 2009 was $3333 The standard deviation of the population of returns is $551, and the amounts follow the normal distribution Using Norm.Dist a What percent of the returns are more than $2000? Answer b What percent of the returns are more than $5000? Answer Answer C. What percent of the returns are between $3000 and $5000? Create an approximate line graph of this normal distribution with $3333 as the mean You can make a table of values from which to create the graph Answer N O Excel Skills Demonstration * x A 1 1 2 3 4 5 6 7 8 9 10 11 12 13 14 15 16 17 18 19 20 21 22 23 24 25 26 27 28 29 30 31 32 33 2 Excel skills B D E F G H T J K L M According to the IRS the mean tax refund for the year 2009 was $3333 The standard deviation of the population of returns is $551, and the amounts follow the normal distribution Using Norm.Dist a What percent of the returns are more than $2000? Answer b What percent of the returns are more than $5000? Answer Answer C. What percent of the returns are between $3000 and $5000? Create an approximate line graph of this normal distribution with $3333 as the mean You can make a table of values from which to create the graph Answer N O
Step by Step Solution
There are 3 Steps involved in it

Get step-by-step solutions from verified subject matter experts