Question: Excel Solutions Only Use the data given here, including the seasonal index, do the following: Time Day Week Measure 110 I Monday 2 Tuesday 3

Excel Solutions Only Excel Solutions Only Use the data given here,
Use the data given here, including the seasonal index, do the following: Time Day Week Measure 110 I Monday 2 Tuesday 3 Wednesday 1 1 95 a (5-points) Create seasonal index numbers using the simple average method. 1 89 b (2 - points) Deseasonalize the data. 4 Thursday 5 Friday 6 Saturday 7 Sunday 1 1 1 93 150 255 c (3-points) Develop a linear trend equation using the deseasonalized data. 1 160 8 Monday 2 105 d (2-points) Develop a trend forecast for Monday and Tuesday of Week 5. 9 Tuesday 2 2 100 2 85 e 10 Wednesday 11 Thursday (2-points)Develop a seasonalized forecast for Monday and Tuesday of Week 5. 2 2 96 2 2 2 3 3 3 3 3 3 3 4 4 155 260 166 109 92 80 78 12 Friday 13 Saturday 14 Sunday 15 Monday 16 Tuesday 17 Wednesday 18 Thursday 19 Friday 20 Saturday 21 Sunday 22 Monday 23 Tuesday 24 Wednesday 25 Thursday 26 Friday 27 Saturday 28 Sunday 152 268 170 112 88 84 90 148 275 4 4 4 4 175

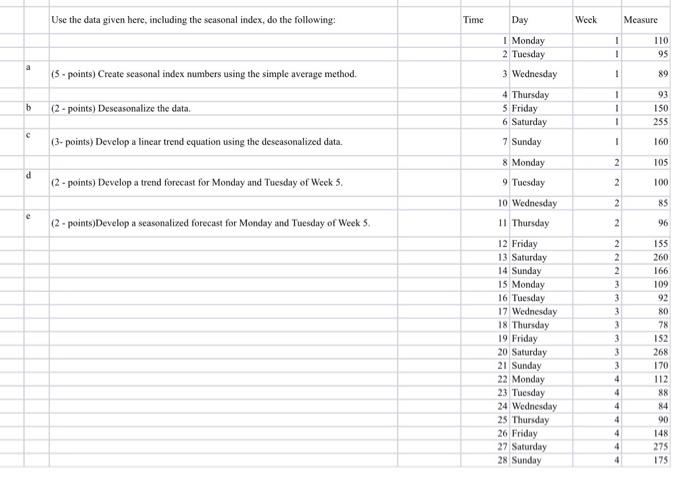
Step by Step Solution

There are 3 Steps involved in it

1 Expert Approved Answer
Step: 1 Unlock blur-text-image
Question Has Been Solved by an Expert!

Get step-by-step solutions from verified subject matter experts

Step: 2 Unlock
Step: 3 Unlock

Students Have Also Explored These Related General Management Questions!