Question: Excel Spreadsheet Exercise The purpose of this assignment is to allow students to get familiar with the use of Excel spreadsheets. Xi ( Xi -

Excel Spreadsheet Exercise The purpose of this assignment is to allow students to get familiar with the use of Excel spreadsheets. Xi ( Xi - X )2 30 0.0025 Month Efficiency Goal 30 0.0025 Base 80.0 80.0 32 4.2025 Jan 79.0 81.0 31 1.1025 Feb 80.0 82.0 30 0.0025 Mar 81.0 83.0 39 81.9025 Apr 79.0 84.0 28 3.8025 May 83.0 85.0 29 0.9025 Jun 84.5 86.0 34 16.4025 Jul 86.0 87.0 33 9.3025 Aug 88.0 30 0.0025 Sep 89.0 29 0.9025 Oct 90.0 28 3.8025 Nov 91.0 26 15.6025 Dec 92.0 30 0.0025 29 0.9025 30 0.0025 27 8.7025 26 15.6025 28 3.8025 Sum (a) 599 166.9500 Use Excel "Sum" formula Number of Observations (n) 20 Use Excel "Count" formula Average = (a) / (n) 29.9500 Use formula (a) / (n) Standard Deviation 2.96426 Use Sample Standard Deviation formula: Standard Deviation 2.96426 Use Excel formula for Standard Deviation for a sample Instructions 1 Develop an Excel Spreadsheet showing everything on this page except the RED instructions 2 Create a Graph as shown, using the Data. Include correct color, titles, etc.. 3 Format Data Tables with Borders as shown. All data should be to correct decimal places. 4 Justify all data and information in cells to left, center, or right as shown 5 Calculate Sum, number of observations, and average for data in Data Table 2. 6 Calculate standard deviation twice, using formulas as instructed. Answers will be the same. 7 Make Data Headings in BOLD Data Table 2 Data Table 1 0.0 10.0 20.0 30.0 40.0 50.0 60.0 70.0 80.0 90.0 100.0 Base Jan Feb Mar Apr May Jun Jul Aug Sep Oct Nov Dec Percent Month Plant Efficiency Efficiency Goal 2 1?Excel Spreadsheet Exercise The purpose of this

X Excel Soreadset Fomework x + File C:/Users/evan Deactop/MET204650 002/Exce20Spreadsheet20Homework Students.pdf no d. 1 of 10 + LA Read aloud A Read aloud V Draw Y Highlight Erase Excel Spreadsheet Exercise The purpose of this assignment is to allow students to get familiar with the use of Excel spreadsheets. Plant Efficiency Month Base Jan Feb Mar Apr May Jun Jul Aug Sep Oct Nov Dec Data Table 1 Efficiency Goal 80.0 80.0 79.0 81.0 80.0 82.0 81.0 83.0 79.0 84.0 83.0 85.0 84.5 86.00 86.0 87.0 88.0 89.0 90.0 91.0 92.0 100.0 900 830 23.0 E EDO 500 400 Data Table 2 Xi (X-X) 30 0.0025 30 0.0025 32 4.2025 31 1.1025 30 0.0025 39 81.9025 28 3.8025 29 0.9025 34 16.4025 33 9.3025 30 0.0025 29 0.9025 28 3.8025 26 15 6025 30 0.0025 29 0.9025 30 0.0025 27 8.7025 26 15,6025 28 3.8025 200 100 0.0 Base Jan Feb Mar Apr May Jun Jul Aug Sep Oct Nov Dec Month -Efficiency Goal Sum al Number of Observations (n) 599 20 166.9500 Use Excel "Suma formula Use Excel "Count formula Average (a) 29.9500 Use formula (a)/(n) 2.96426 Use Sample Standard Deviation formula 204) Standard Deviation Standard Deviation 2.96426 Use Excel formula for Standard Deviation for a sample Instructions 1 Develop an Excel Spreadsheet showing everything on this page except the RED instructions 2 Create a Graph as shown, using the Data. Include correct color, titles, etc. 3 Format Data Tables with Borders as shown. All data should be to correct decimal places. 4 Justify all data and information in cells to left, center, or right as shown 5 Calculate Sum, number of observations, and average for data in Data Table 2. 6 Calculate standard deviation twice, using formulas as instructed. Answers will be the same 7 Make Data Headings in BOLD Type here to search A4 1:14 PM 4/12/2021

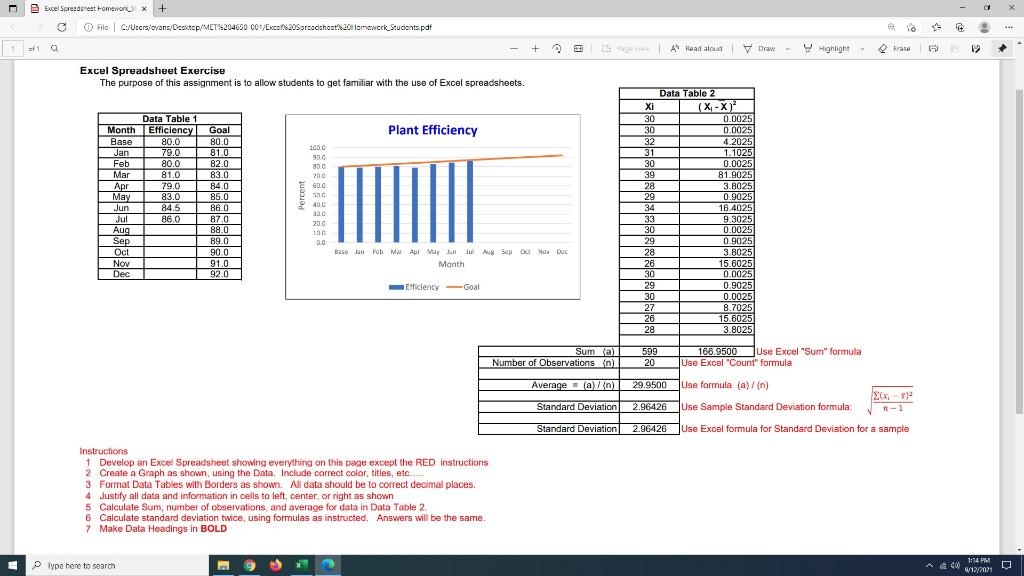
Step by Step Solution

There are 3 Steps involved in it

1 Expert Approved Answer
Step: 1 Unlock blur-text-image
Question Has Been Solved by an Expert!

Get step-by-step solutions from verified subject matter experts

Step: 2 Unlock
Step: 3 Unlock

Students Have Also Explored These Related General Management Questions!