

Question: EXCEL SPREADSHEET: How do I go about answering this question and creating the PivotTable using the data below from the new fees report (picture) DeShawn
EXCEL SPREADSHEET: How do I go about answering this question and creating the PivotTable using the data below from the new fees report (picture)
- DeShawn also wants to focus on one or two types of small-group training sessions at a time when comparing the average profit per program. Return to the New Fees worksheet and create another type of report as follows:
- Create a Scenario PivotTable report using the average profit per program (range B10:F10) as the result cells to compare the average profit depending on the fee changes in a PivotTable.
- Use New Fees PivotTable as the name of the worksheet containing the PivotTable.
Format cells B4:F6 in the New Fees PivotTable worksheet using the Accounting number format with 0 decimal places and $ as the symbol
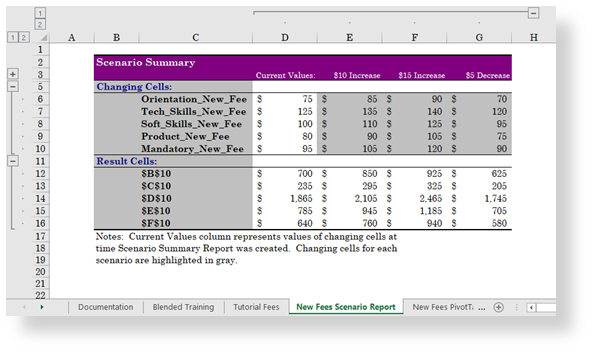
Notes: Current Values column represents values of changing cells at time Scenario Summary Report was created. Changing cells for each scenario are highlighted in gray
Step by Step Solution
There are 3 Steps involved in it
1 Expert Approved Answer
Step: 1 Unlock

Question Has Been Solved by an Expert!
Get step-by-step solutions from verified subject matter experts
Step: 2 Unlock
Step: 3 Unlock