

Question: Excel template - Saved O Search (Alt + Q) Single Line Ribbon Sign in 8 File Home Insert Formulas Data Review View Help Editing Comments
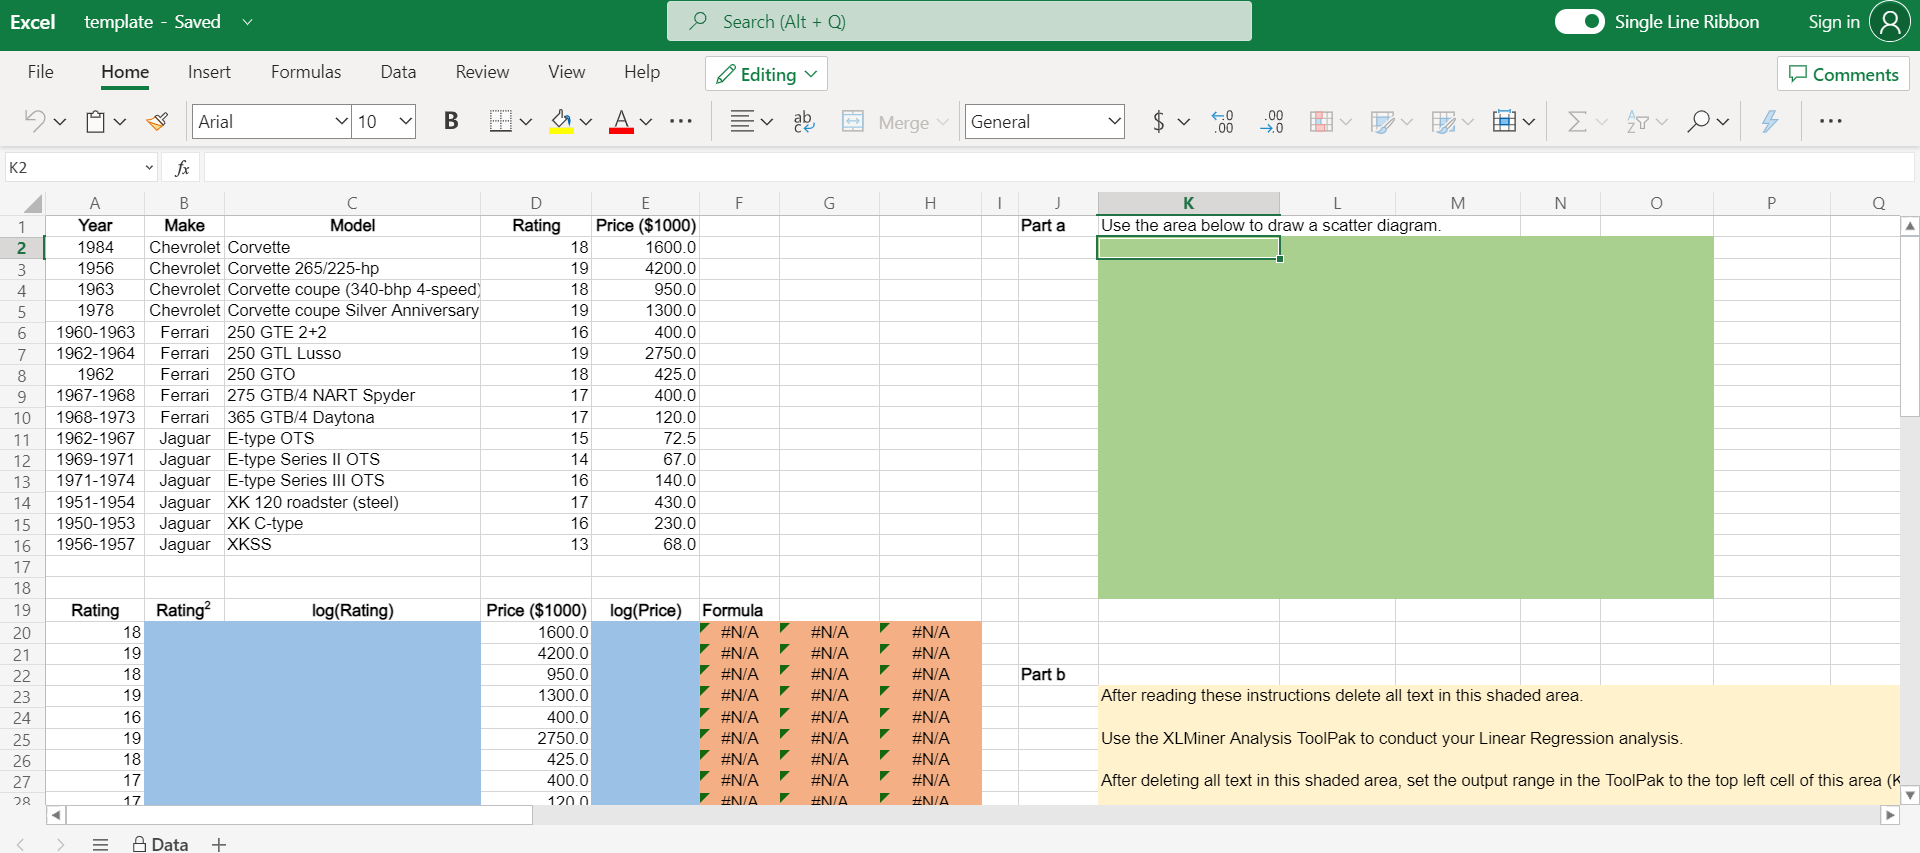
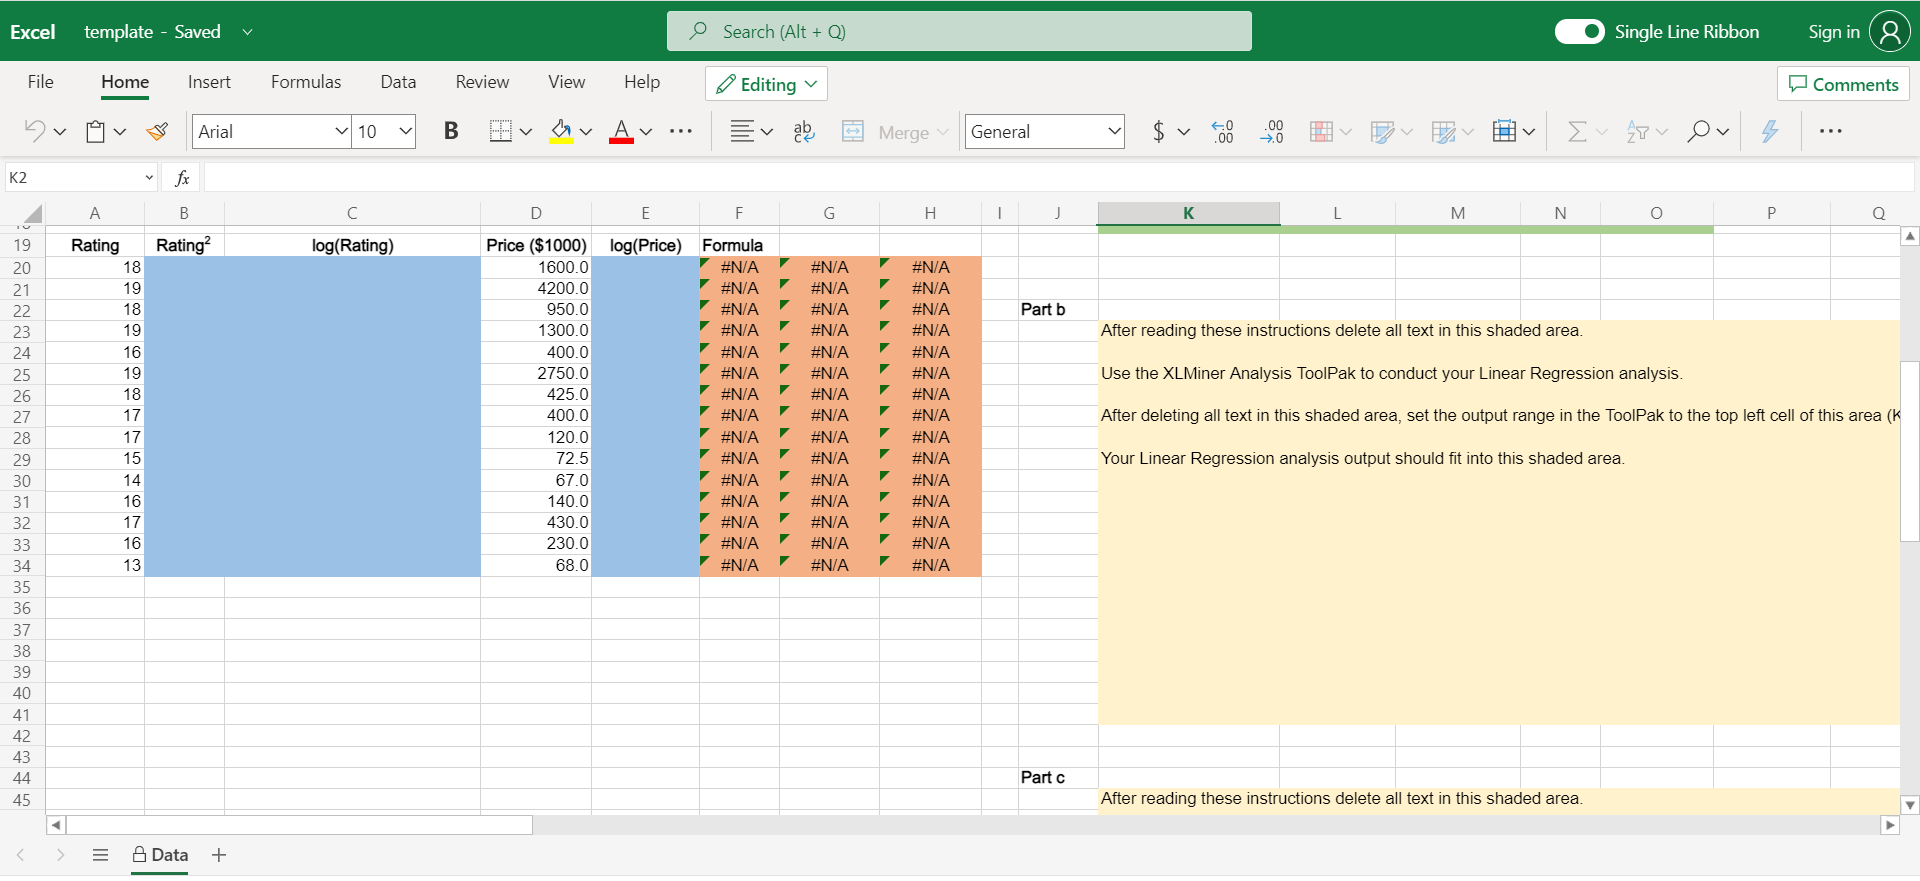
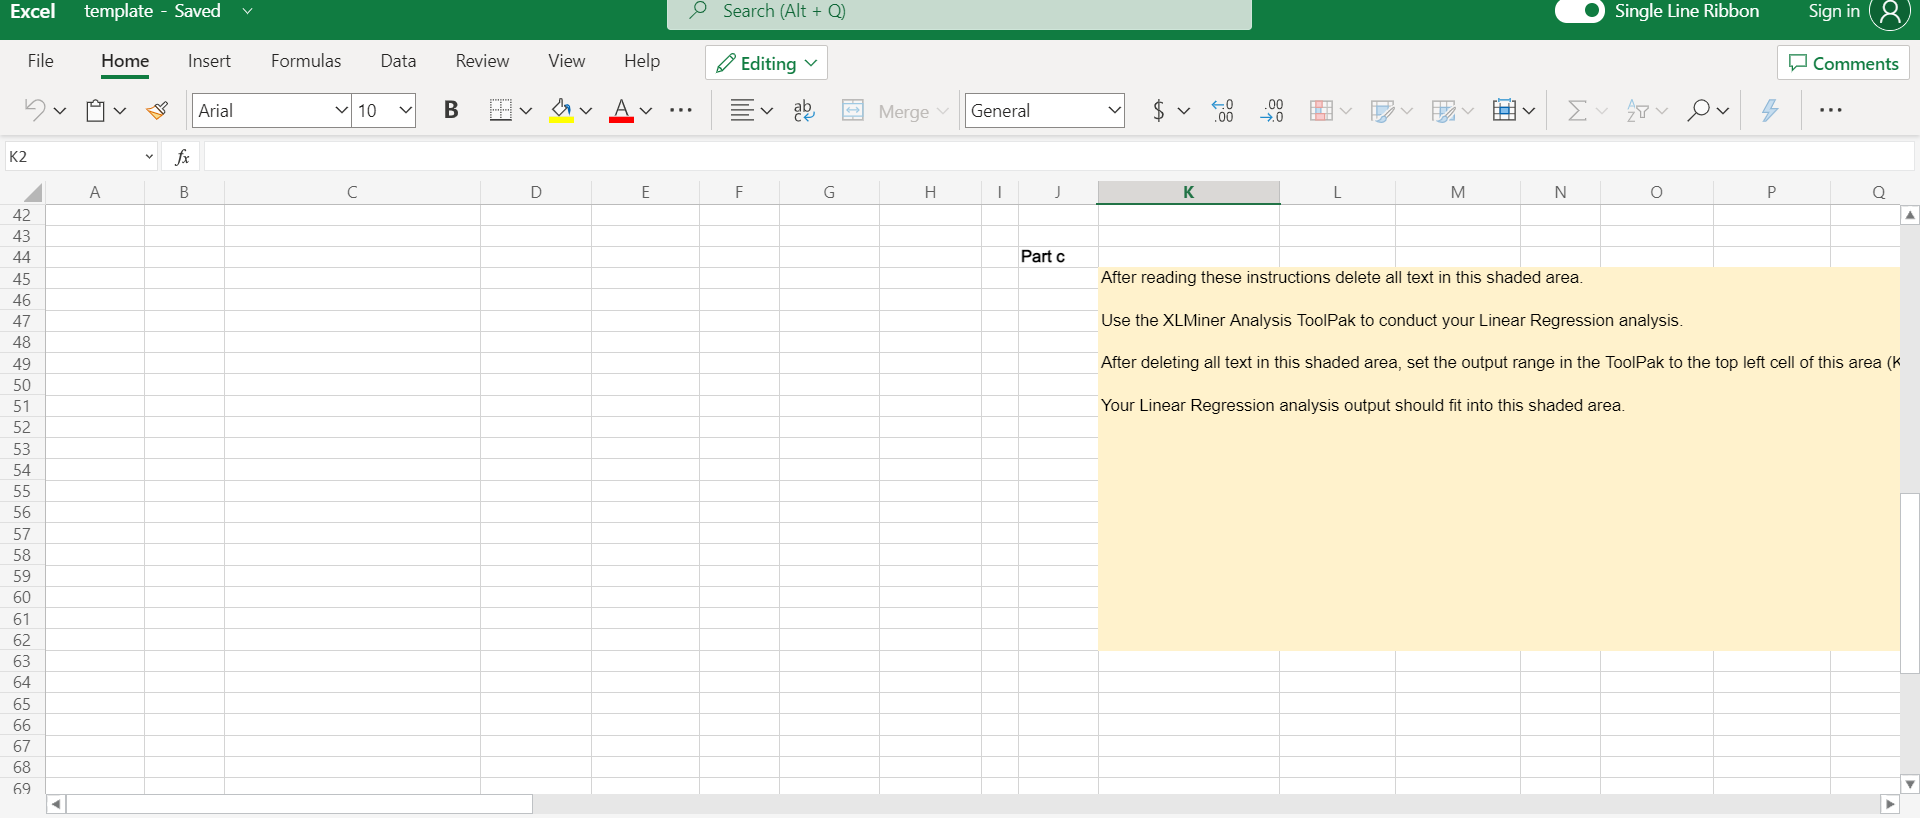
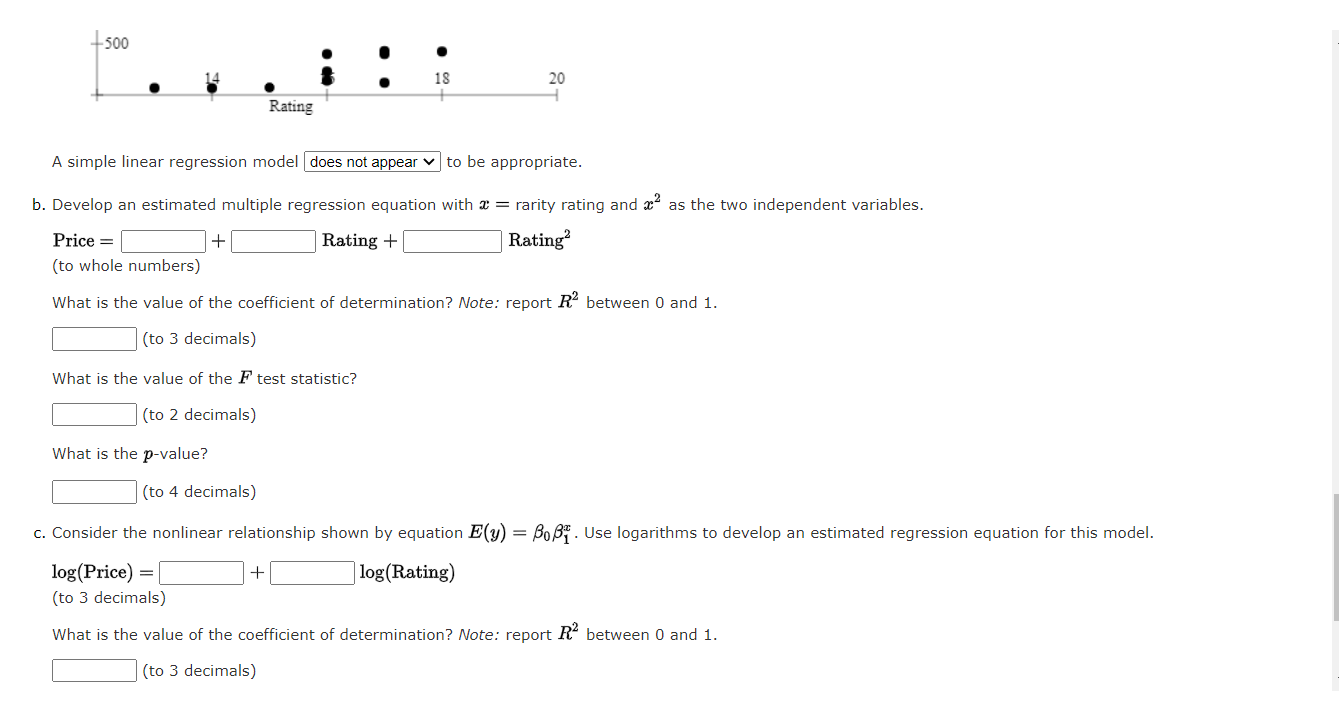
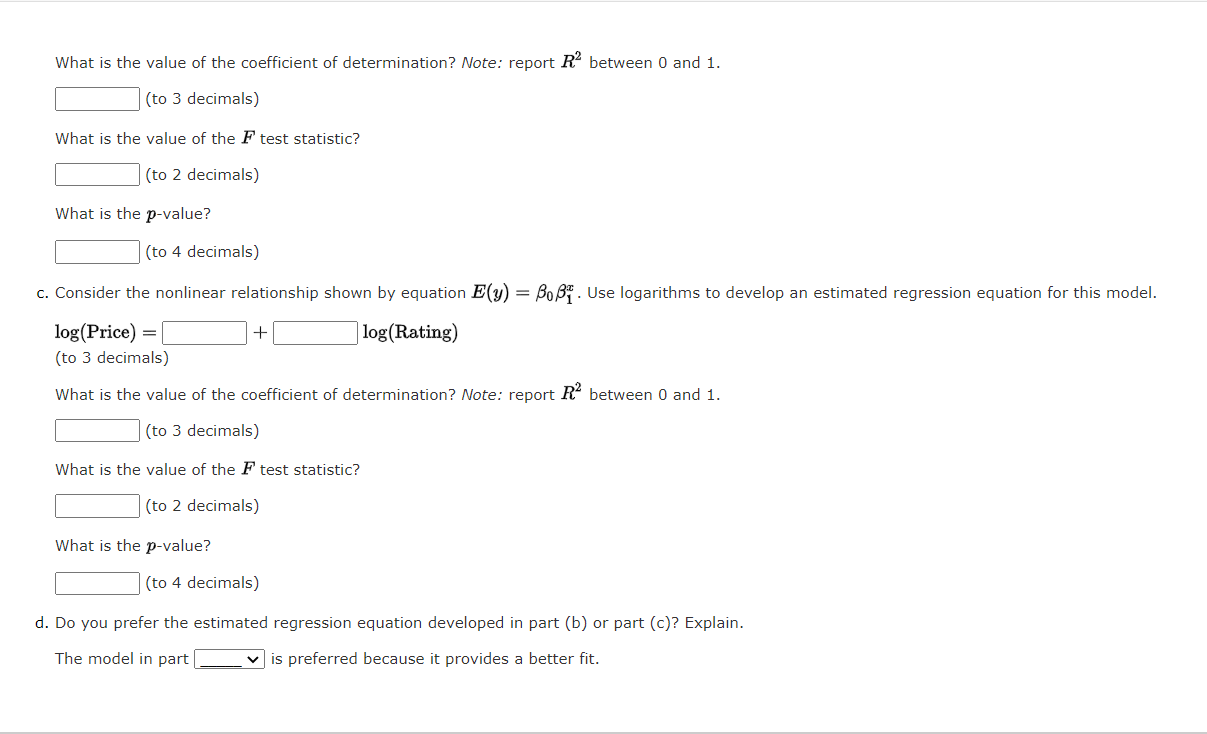
Excel template - Saved O Search (Alt + Q) Single Line Ribbon Sign in 8 File Home Insert Formulas Data Review View Help Editing Comments Arial 10 B v v Av Merge General 60 .00 .00 >0 7 K2 fx F G H 1 N O 0 D Rating Part a K M Use the area below to draw a scatter diagram. 1 2 3 4 5 6 7 8 9 10 11 12 13 14 15 16 17 18 19 Year 1984 1956 1963 1978 1960-1963 1962-1964 1962 1967-1968 1968-1973 1962-1967 1969-1971 1971-1974 1951-1954 1950-1953 1956-1957 B Make Model Chevrolet Corvette Chevrolet Corvette 265/225-hp Chevrolet Corvette coupe (340-bhp 4-speed) Chevrolet Corvette coupe Silver Anniversary Ferrari 250 GTE 2+2 Ferrari 250 GTL Lusso Ferrari 250 GTO Ferrari 275 GTB/4 NART Spyder Ferrari 365 GTB/4 Daytona Jaguar E-type OTS Jaguar E-type Series II OTS Jaguar E-type Series III OTS Jaguar XK 120 roadster (steel) Jaguar XK C-type Jaguar XKSS E Price ($1000) 18 1600.0 19 4200.0 18 950.0 19 1300.0 16 400.0 19 2750.0 18 425.0 17 400.0 17 15 72.5 14 67.0 16 140.0 17 430.0 16 230.0 13 68.0 120.0 Rating? log(Rating) log(Price) Formula #N/A #N/A #N/A Part b Rating 18 19 18 19 16 19 18 17 17 20 21 22 23 24 25 26 27 29 Price ($1000) 1600.0 4200.0 950.0 1300.0 400.0 2750.0 425.0 400.0 120.0 After reading these instructions delete all text in this shaded area. #N/A #N/A 7 #/ #N/A #N/A #N/A #N/A #N/A #N/A #N/A #N/A #N/A #N/A #N/A #N/A #N/A #N/A #N/A #N/A #N/A #N/A #N/A Use the XLMiner Analysis ToolPak to conduct your Linear Regression analysis. #N/A #N/A #N/A After deleting all text in this shaded area, set the output range in the ToolPak to the top left cell of this area (k Data + Excel template - Saved O Search (Alt + Q) Single Line Ribbon Sign in File Home Insert Formulas Data Review View Help Editing Comments Arial v 10 B hov Merge General 60 .00 .00 >0 v E27 v Ov K2 fx B D E F G . 1 K L M N O P. O Rating? log(Rating) #N/A Part b #N/A #N/A #N/A #N/A #N/A #N/A #N/A After reading these instructions delete all text in this shaded area. #N/A Use the XLMiner Analysis ToolPak to conduct your Linear Regression analysis. Rating 18 19 18 19 16 19 18 17 17 15 14 16 17 16 13 Price ($1000) log(Price) Formula 1600.0 #N/A 4200.0 950.0 #N/A 1300.0 #N/A 400.0 2750.0 #N/A 425.0 #N/A 400.0 120.0 72.5 #N/A 67.0 #N/A 140.0 #N/A 430.0 230.0 #N/A 68.0 #N/A #N/A #N/A #N/A 19 20 21 22 23 24 25 26 27 28 29 30 31 32 33 34 35 36 37 38 39 40 41 42. 43 44 45 #N/A #N/A #N/A #N/A #N/A #N/A #N/A #N/A #N/A #N/A #N/A #N/A #N/A #N/A #NA After deleting all text in this shaded area, set the output range in the ToolPak to the top left cell of this area (k Your Linear Regression analysis output should fit into this shaded area. #N/A #N/A #N/A #N/A #N/A #N/A #N/A 7 #N/A Partc After reading these instructions delete all text in this shaded area. > Data + Excel template - Saved Search (Alt +Q) Single Line Ribbon Sign in & File Home Insert Formulas Data Review View Help Editing Comments Arial v 10 B hv v aby General $v Merge 40 .00 IH Hv E 27v Ov 4 K2 fx A B C D E F G H K M N O Q Partc After reading these instructions delete all text in this shaded area. Use the XLMiner Analysis ToolPak to conduct your Linear Regression analysis. After deleting all text in this shaded area, set the output range in the ToolPak to the top left cell of this area (k Your Linear Regression analysis output should fit into this shaded area. 42 43 44 45 46 47 48 49 50 51 52 53 54 55 56 57 58 59 60 61 62 63 64 65 66 67 68 69 +500 18 20 Rating A simple linear regression model does not appear to be appropriate. b. Develop an estimated multiple regression equation with a = rarity rating and a2 as the two independent variables. Price = + Rating + Rating? (to whole numbers) What is the value of the coefficient of determination? Note: report R between 0 and 1. (to 3 decimals) What is the value of the F test statistic? (to 2 decimals) What is the p-value? (to 4 decimals) C. Consider the nonlinear relationship shown by equation E(y) = BOBI. Use logarithms to develop an estimated regression equation for this model. log(Price) = + log(Rating) (to 3 decimals) What is the value of the coefficient of determination? Note: report R2 between 0 and 1. (to 3 decimals) What is the value of the coefficient of determination? Note: report R between 0 and 1. (to 3 decimals) What is the value of the F test statistic? (to 2 decimals) What is the p-value? (to 4 decimals) + c. Consider the nonlinear relationship shown by equation E(y) = Bo Bi. Use logarithms to develop an estimated regression equation for this model. log(Price) = log(Rating) (to 3 decimals) What is the value of the coefficient of determination? Note: report R2 between 0 and 1. (to 3 decimals) What is the value of the F test statistic? (to 2 decimals) What is the p-value? (to 4 decimals) d. Do you prefer the estimated regression equation developed in part (b) or part (c)? Explain. The model in part v is preferred because it provides a better fit. Excel template - Saved O Search (Alt + Q) Single Line Ribbon Sign in 8 File Home Insert Formulas Data Review View Help Editing Comments Arial 10 B v v Av Merge General 60 .00 .00 >0 7 K2 fx F G H 1 N O 0 D Rating Part a K M Use the area below to draw a scatter diagram. 1 2 3 4 5 6 7 8 9 10 11 12 13 14 15 16 17 18 19 Year 1984 1956 1963 1978 1960-1963 1962-1964 1962 1967-1968 1968-1973 1962-1967 1969-1971 1971-1974 1951-1954 1950-1953 1956-1957 B Make Model Chevrolet Corvette Chevrolet Corvette 265/225-hp Chevrolet Corvette coupe (340-bhp 4-speed) Chevrolet Corvette coupe Silver Anniversary Ferrari 250 GTE 2+2 Ferrari 250 GTL Lusso Ferrari 250 GTO Ferrari 275 GTB/4 NART Spyder Ferrari 365 GTB/4 Daytona Jaguar E-type OTS Jaguar E-type Series II OTS Jaguar E-type Series III OTS Jaguar XK 120 roadster (steel) Jaguar XK C-type Jaguar XKSS E Price ($1000) 18 1600.0 19 4200.0 18 950.0 19 1300.0 16 400.0 19 2750.0 18 425.0 17 400.0 17 15 72.5 14 67.0 16 140.0 17 430.0 16 230.0 13 68.0 120.0 Rating? log(Rating) log(Price) Formula #N/A #N/A #N/A Part b Rating 18 19 18 19 16 19 18 17 17 20 21 22 23 24 25 26 27 29 Price ($1000) 1600.0 4200.0 950.0 1300.0 400.0 2750.0 425.0 400.0 120.0 After reading these instructions delete all text in this shaded area. #N/A #N/A 7 #/ #N/A #N/A #N/A #N/A #N/A #N/A #N/A #N/A #N/A #N/A #N/A #N/A #N/A #N/A #N/A #N/A #N/A #N/A #N/A Use the XLMiner Analysis ToolPak to conduct your Linear Regression analysis. #N/A #N/A #N/A After deleting all text in this shaded area, set the output range in the ToolPak to the top left cell of this area (k Data + Excel template - Saved O Search (Alt + Q) Single Line Ribbon Sign in File Home Insert Formulas Data Review View Help Editing Comments Arial v 10 B hov Merge General 60 .00 .00 >0 v E27 v Ov K2 fx B D E F G . 1 K L M N O P. O Rating? log(Rating) #N/A Part b #N/A #N/A #N/A #N/A #N/A #N/A #N/A After reading these instructions delete all text in this shaded area. #N/A Use the XLMiner Analysis ToolPak to conduct your Linear Regression analysis. Rating 18 19 18 19 16 19 18 17 17 15 14 16 17 16 13 Price ($1000) log(Price) Formula 1600.0 #N/A 4200.0 950.0 #N/A 1300.0 #N/A 400.0 2750.0 #N/A 425.0 #N/A 400.0 120.0 72.5 #N/A 67.0 #N/A 140.0 #N/A 430.0 230.0 #N/A 68.0 #N/A #N/A #N/A #N/A 19 20 21 22 23 24 25 26 27 28 29 30 31 32 33 34 35 36 37 38 39 40 41 42. 43 44 45 #N/A #N/A #N/A #N/A #N/A #N/A #N/A #N/A #N/A #N/A #N/A #N/A #N/A #N/A #NA After deleting all text in this shaded area, set the output range in the ToolPak to the top left cell of this area (k Your Linear Regression analysis output should fit into this shaded area. #N/A #N/A #N/A #N/A #N/A #N/A #N/A 7 #N/A Partc After reading these instructions delete all text in this shaded area. > Data + Excel template - Saved Search (Alt +Q) Single Line Ribbon Sign in & File Home Insert Formulas Data Review View Help Editing Comments Arial v 10 B hv v aby General $v Merge 40 .00 IH Hv E 27v Ov 4 K2 fx A B C D E F G H K M N O Q Partc After reading these instructions delete all text in this shaded area. Use the XLMiner Analysis ToolPak to conduct your Linear Regression analysis. After deleting all text in this shaded area, set the output range in the ToolPak to the top left cell of this area (k Your Linear Regression analysis output should fit into this shaded area. 42 43 44 45 46 47 48 49 50 51 52 53 54 55 56 57 58 59 60 61 62 63 64 65 66 67 68 69 +500 18 20 Rating A simple linear regression model does not appear to be appropriate. b. Develop an estimated multiple regression equation with a = rarity rating and a2 as the two independent variables. Price = + Rating + Rating? (to whole numbers) What is the value of the coefficient of determination? Note: report R between 0 and 1. (to 3 decimals) What is the value of the F test statistic? (to 2 decimals) What is the p-value? (to 4 decimals) C. Consider the nonlinear relationship shown by equation E(y) = BOBI. Use logarithms to develop an estimated regression equation for this model. log(Price) = + log(Rating) (to 3 decimals) What is the value of the coefficient of determination? Note: report R2 between 0 and 1. (to 3 decimals) What is the value of the coefficient of determination? Note: report R between 0 and 1. (to 3 decimals) What is the value of the F test statistic? (to 2 decimals) What is the p-value? (to 4 decimals) + c. Consider the nonlinear relationship shown by equation E(y) = Bo Bi. Use logarithms to develop an estimated regression equation for this model. log(Price) = log(Rating) (to 3 decimals) What is the value of the coefficient of determination? Note: report R2 between 0 and 1. (to 3 decimals) What is the value of the F test statistic? (to 2 decimals) What is the p-value? (to 4 decimals) d. Do you prefer the estimated regression equation developed in part (b) or part (c)? Explain. The model in part v is preferred because it provides a better fit
Step by Step Solution
There are 3 Steps involved in it

Get step-by-step solutions from verified subject matter experts