

Question: Excel template - Saved Search (Option + Q) File Home Insert Draw Page Layout Formulas Data Review View Help Editing Comments 5 v Q v
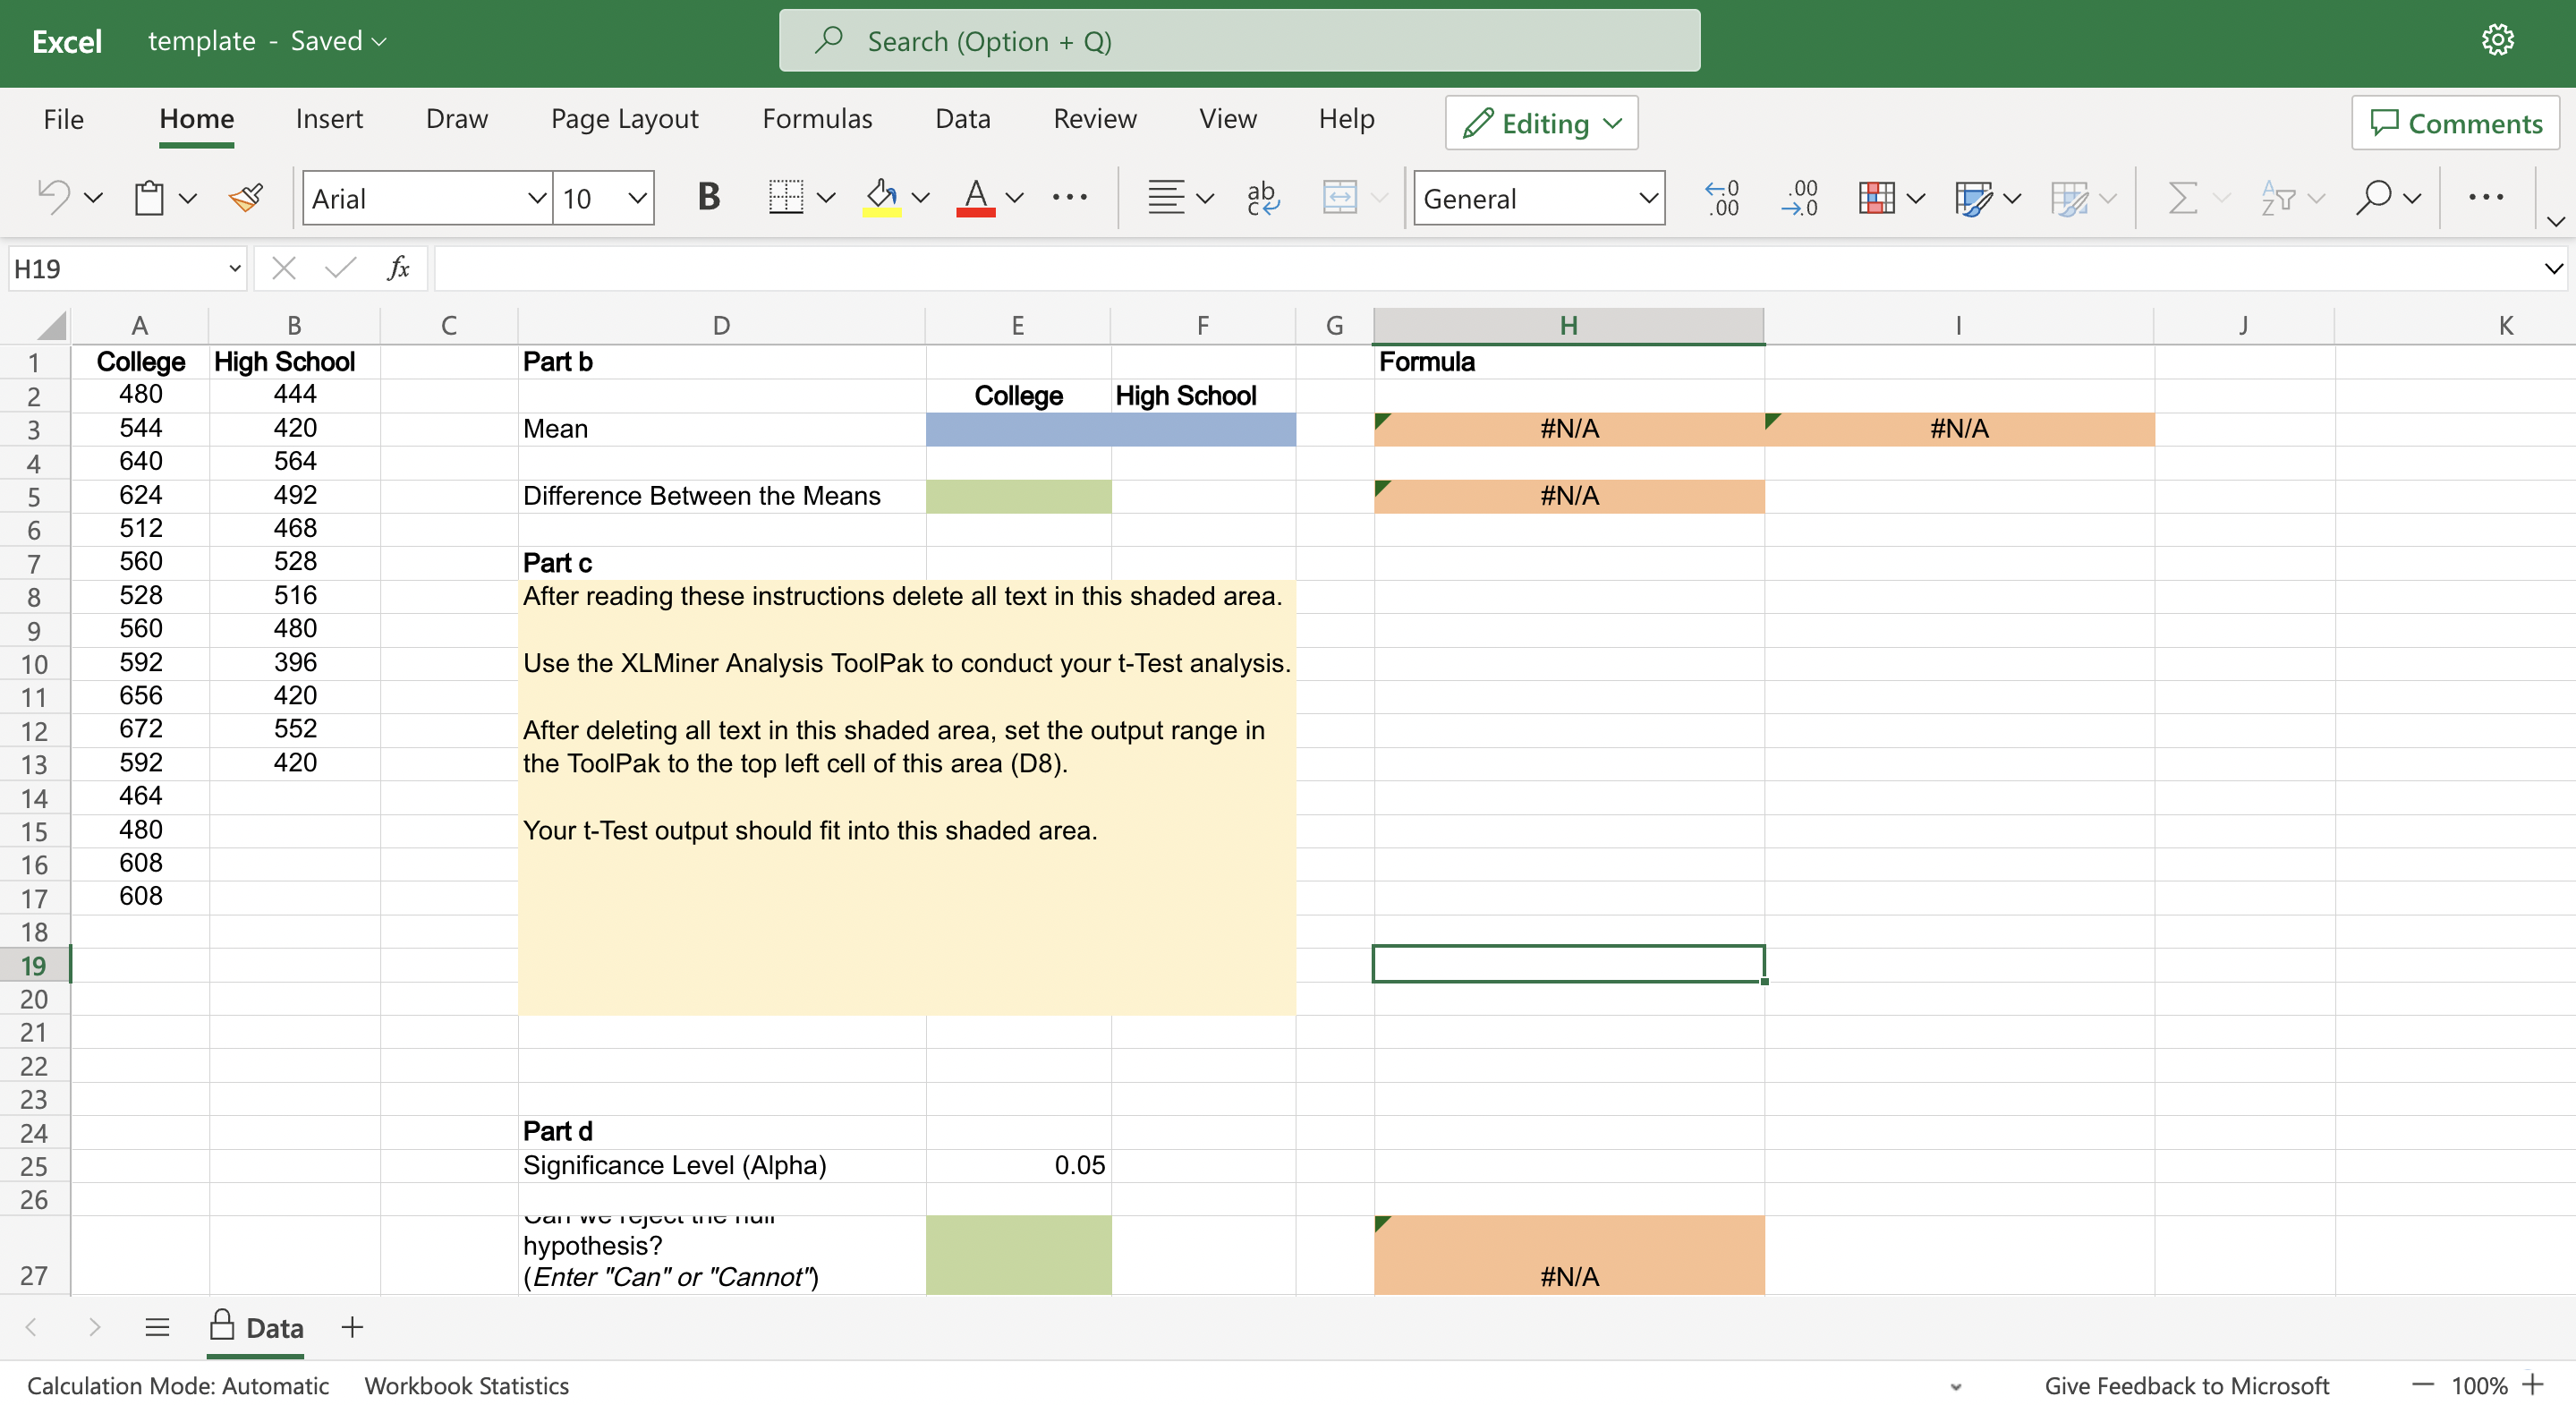
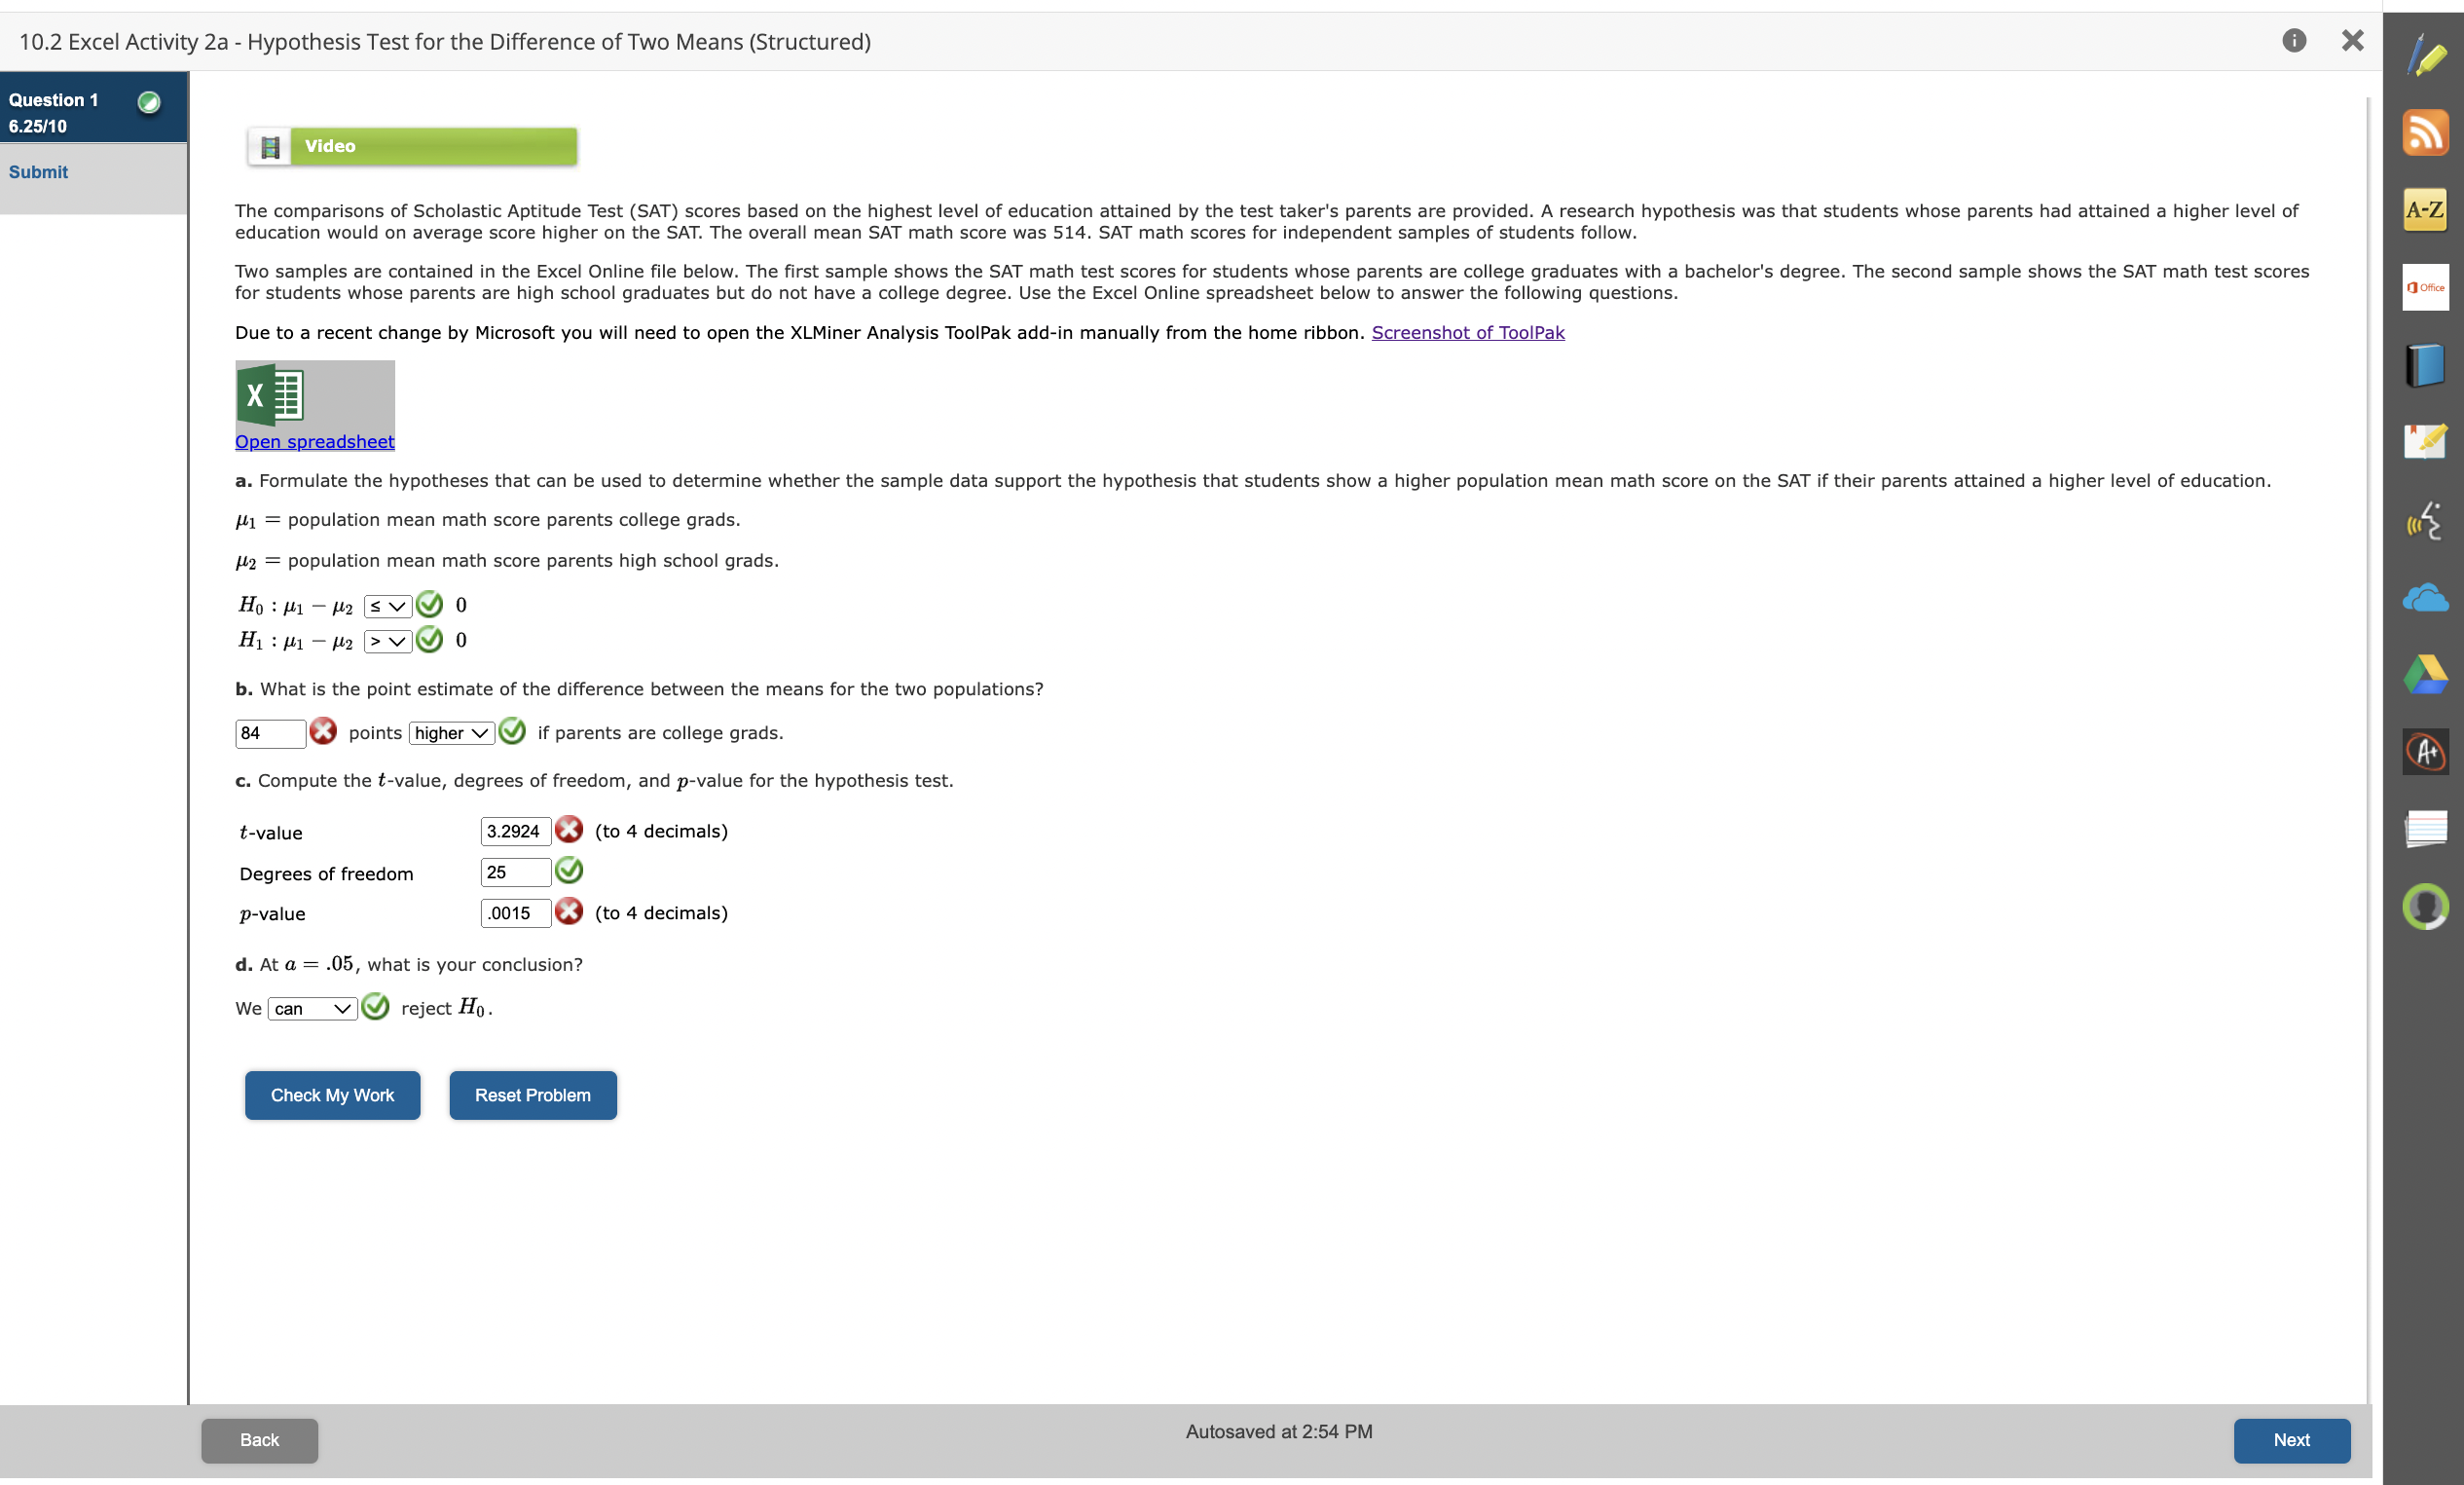
Excel template - Saved Search (Option + Q) File Home Insert Draw Page Layout Formulas Data Review View Help Editing Comments 5 v Q v Arial 10 v B My Av ... Ev .00 General 00 Ov . .. V H19 " X V fx A B C D E F G H I J K College High School Part b Formula 480 444 College High School A W N - 544 420 Mean #N/A #N/A 640 564 624 492 Difference Between the Means #N/A 512 468 560 528 Part c 528 516 After reading these instructions delete all text in this shaded area. 560 480 10 592 396 Use the XLMiner Analysis ToolPak to conduct your t-Test analysis. 11 656 420 12 672 552 After deleting all text in this shaded area, set the output range in 13 592 420 the ToolPak to the top left cell of this area (D8). 14 464 15 480 Your t-Test output should fit into this shaded area. 16 608 17 608 18 19 20 21 22 23 24 Part d 25 Significance Level (Alpha) 0.05 26 hypothesis? 27 (Enter "Can" or "Cannot") #N/A
Step by Step Solution
There are 3 Steps involved in it

Get step-by-step solutions from verified subject matter experts