

Question: Excel Use the Excel Megamart Case File to complete the following work. 1. Create 3 new copies of the P05 1 sheet since you will
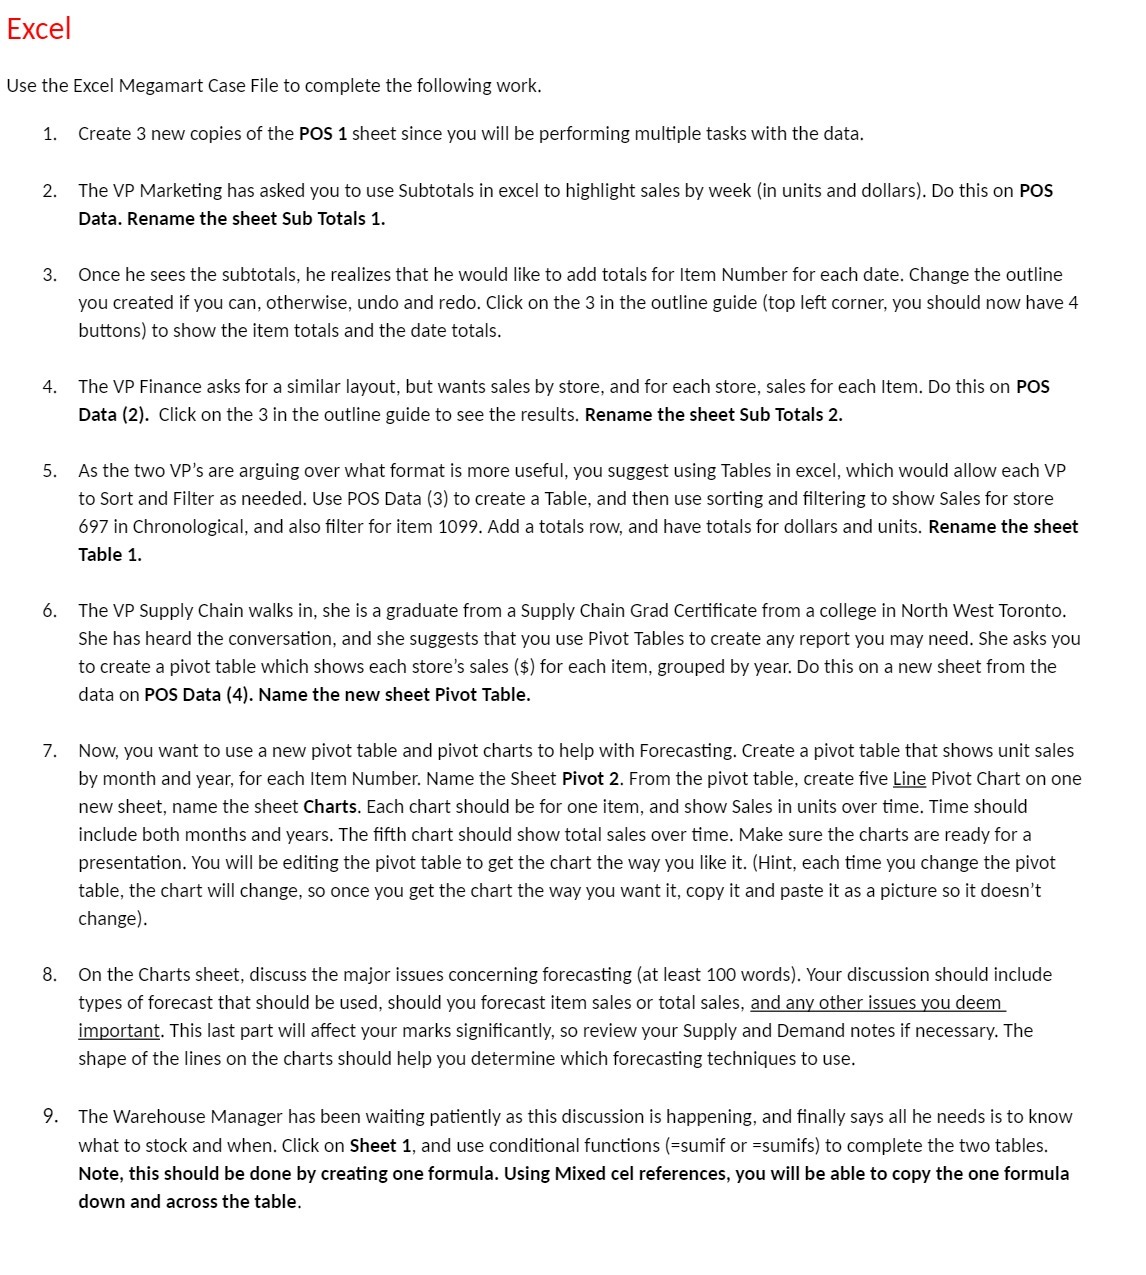
Excel Use the Excel Megamart Case File to complete the following work. 1. Create 3 new copies of the P05 1 sheet since you will be performing multiple tasks with the data. The VP Marketing has asked you to use Subtotals in excel to highlight sales by week [in units and dollars). Do this on POS Data. Rename the sheet Sub Totals 1. Once he sees the subtotals, he realizes that he would like to add totals for Item Number for each date. Change the outline you created if you can, otherwise, undo and redo. Click on the 3 in the outline guide (top left corner, you should now have 4 buttons) to show the item totals and the date totals. The VP Finance asks for a similar layout, but wants sales by store, and for each store, sales for each Item. Do this on P05 Data {2). Click on the 3 in the outline guide to see the results. Rename the sheet Sub Totals 2. As the two VP's are arguing over what format is more useful, you suggest using Tables in excel, which would allow each VP to Sort and Filter as needed. Use POS Data (3) to create a Table, and then use sorting and ltering to show Sales for store 697 in Chronological, and also lter for item 1099. Add a totals row, and have totals for dollars and units. Rename the sheet Table 1. The VP Supply Chain walks in, she is a graduate from a Supply Chain Grad Certicate from a college in North West Toronto. She has heard the conversation, and she suggests that you use Pivot Tables to create any report you may need. She asks you to create a pivot table which shows each store's sales [$) for each item, grouped by year. Do this on a new sheet from the data on P05 Data {4). Name the new sheet Pivot Table. Now, you want to use a new pivot table and pivot charts to help with Forecasting. Create a pivot table that shows unit sales by month and year, for each Item Number. Name the Sheet Pivot 2. From the pivot table, create ve HE Pivot Chart on one new sheet, name the sheet Charts. Each chart should be for one item, and show Sales in units over time. Time should include both months and years. The fth chart should show total sales over time. Make sure the charts are ready for a presentation. You will be editing the pivot table to get the chart the way you like it. (Hint, each time you change the pivot table, the chart will change. so once you get the chart the way you want it, copy it and paste it as a picture so it doesn't change). On the Charts sheet, discuss the major issues concerning forecasng [at least 100 words]. Your discussion should include types of forecast that should be used, should you forecast item sales or total sales, and any other issues you deem important. This last part will affect your marks signicantly, so review your Supply and Demand notes if necessary. The shape of the lines on the charts should help you determine which forecasting techniques to use. The Warehouse Manager has been waiting patiently as this discussion is happening, and nally says all he needs is to know what to stock and when. Click on Sheet 1, and use condional functions [=sumif or =sumifs] to complete the two tables. Note, this should be done by creating one formula. Using Mixed cel references, you will be able to copy the one formula down and across the table
Step by Step Solution
There are 3 Steps involved in it

Get step-by-step solutions from verified subject matter experts