

Question: (Excel) Visualizing Data and PIVOT Tables: PIVOT Table familiarity and the development of charts. Use the attached file below Heavenly Chocolates Lab for this exercise.
Visualizing Data and PIVOT Tables: PIVOT Table familiarity and the development of charts.
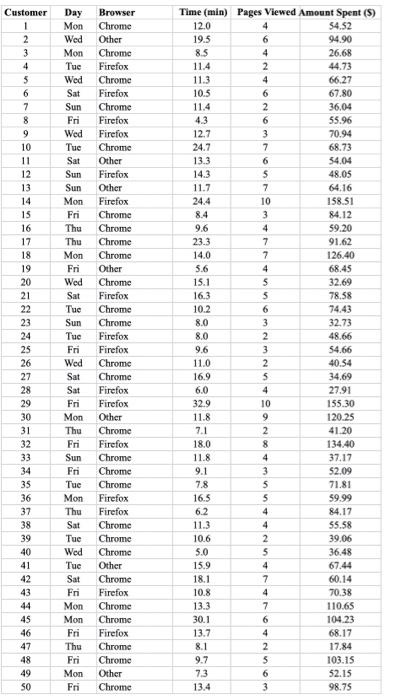
Use the attached file below "Heavenly Chocolates Lab" for this exercise.
FILE: Heavenly Chocolates Lab _Blank_.xlsx
PART 1: Segmentation of customers by spending
a. Highlight the entire data set and create a PIVOT table on a new worksheet within the workbook. Label this worksheet "Spending"
b. Configure the "Amount Spent" field in the Columns box and the Count of Customer in the Sum of Values box.
(Select the fields first in the top box!) [Remember to change the value of field to Count!]
c. Using the Group option (right click on any Amount Spent cell) with the Amount Spent, group this in increments of $10, starting at $0.
d. Create a pie chart of the results showing the proportion of customers in each spending category with percentages on the labels.
PART 2: Develop weekly profile
a. Repeat "a" in Part 1 in creating a new PIVOT Table worksheet. Name the worksheet "Weekly Profile".
b. Configure the Day field and then the Amount Spent field (in that order) in the Rows box and the Count of Customer in the Sum of Values box.
c. Using the Group option (right click) with the Amount Spent, group this in increments of $10, starting at $0.
d. Show the frequency (count) of customers by Day of Week, then Amount Spent using a clustered vertical column chart.
PART 3: Browser Analysis - Spending and Viewing Time by browser
a. Repeat "a" in Part 1 in creating a new PIVOT Table worksheet. Name the worksheet "Browsers".
b. Configure the Amount Spent field and the Time field (in that order) in the Rows box, then the Browser field in the Columns box, and end with Count of Customer in the Sum of Values box.
c. Using the Group option (right click) with the Amount Spent, group this in increments of $10, starting at $0.
d. Repeat "c" above with the viewing time grouped in intervals of 5 minutes starting at 0.
Once complete, proceed to Step 2 to validate your numbers.
Step by Step Solution
There are 3 Steps involved in it

Get step-by-step solutions from verified subject matter experts