

Question: excel worksheet please Financial Analysis Problem Create a table which compares loan payment amounts for different interest rates and different loan terms. To simplify your
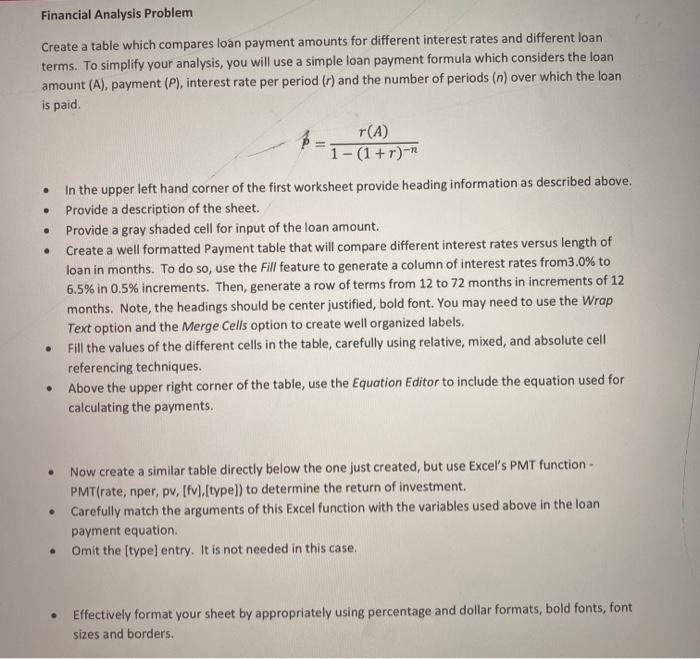
Financial Analysis Problem Create a table which compares loan payment amounts for different interest rates and different loan terms. To simplify your analysis, you will use a simple loan payment formula which considers the loan amount (A), payment (P), interest rate per period (r) and the number of periods (n) over which the loan is paid r(A) 1-(1 + r)-n . . . In the upper left hand corner of the first worksheet provide heading information as described above. Provide a description of the sheet. Provide a gray shaded cell for input of the loan amount. Create a well formatted Payment table that will compare different interest rates versus length of loan in months. To do so, use the Fill feature to generate a column of interest rates from3.0% to 6.5% in 0.5% increments. Then, generate a row of terms from 12 to 72 months in increments of 12 months. Note, the headings should be center justified, bold font. You may need to use the Wrap Text option and the Merge Cells option to create well organized labels. Fill the values of the different cells in the table, carefully using relative, mixed, and absolute cell referencing techniques. Above the upper right corner of the table, use the Equation Editor to include the equation used for calculating the payments. . Now create a similar table directly below the one just created, but use Excel's PMT function - PMT(rate, nper, pv, [fv).[type]) to determine the return of investment Carefully match the arguments of this Excel function with the variables used above in the loan payment equation. Omit the (type) entry. It is not needed in this case. Effectively format your sheet by appropriately using percentage and dollar formats, bold fonts, font sizes and borders. Financial Analysis Problem Create a table which compares loan payment amounts for different interest rates and different loan terms. To simplify your analysis, you will use a simple loan payment formula which considers the loan amount (A), payment (P), interest rate per period (r) and the number of periods (n) over which the loan is paid r(A) 1-(1 + r)-n . . . In the upper left hand corner of the first worksheet provide heading information as described above. Provide a description of the sheet. Provide a gray shaded cell for input of the loan amount. Create a well formatted Payment table that will compare different interest rates versus length of loan in months. To do so, use the Fill feature to generate a column of interest rates from3.0% to 6.5% in 0.5% increments. Then, generate a row of terms from 12 to 72 months in increments of 12 months. Note, the headings should be center justified, bold font. You may need to use the Wrap Text option and the Merge Cells option to create well organized labels. Fill the values of the different cells in the table, carefully using relative, mixed, and absolute cell referencing techniques. Above the upper right corner of the table, use the Equation Editor to include the equation used for calculating the payments. . Now create a similar table directly below the one just created, but use Excel's PMT function - PMT(rate, nper, pv, [fv).[type]) to determine the return of investment Carefully match the arguments of this Excel function with the variables used above in the loan payment equation. Omit the (type) entry. It is not needed in this case. Effectively format your sheet by appropriately using percentage and dollar formats, bold fonts, font sizes and borders
Step by Step Solution
There are 3 Steps involved in it

Get step-by-step solutions from verified subject matter experts