

Question: Exceptional Service Grading Company available here. Using the learning resources provided in the Reading Assignment, perform a financial ratio analysis of the company using the
Exceptional Service Grading Company available here. Using the learning resources provided in the Reading Assignment, perform a financial ratio analysis of the company using the following ratios:
Gross profit margin
Current ratio
Debt ratio
Locate two other ratios to calculate. Define them and explain their purpose and how they add value to your analysis.
Select significant lines from the financial statements and provide an observation of their trends. For example, if the account is increasing or decreasing in value, what would that indicate?
Draw some conclusions based on your observations. For example:
Is there any viability for a new project?
Why do you think the assets of the company went up from 2017 to 2018?
What implications does this have?
What follow-up questions do you have to ask the companys management?
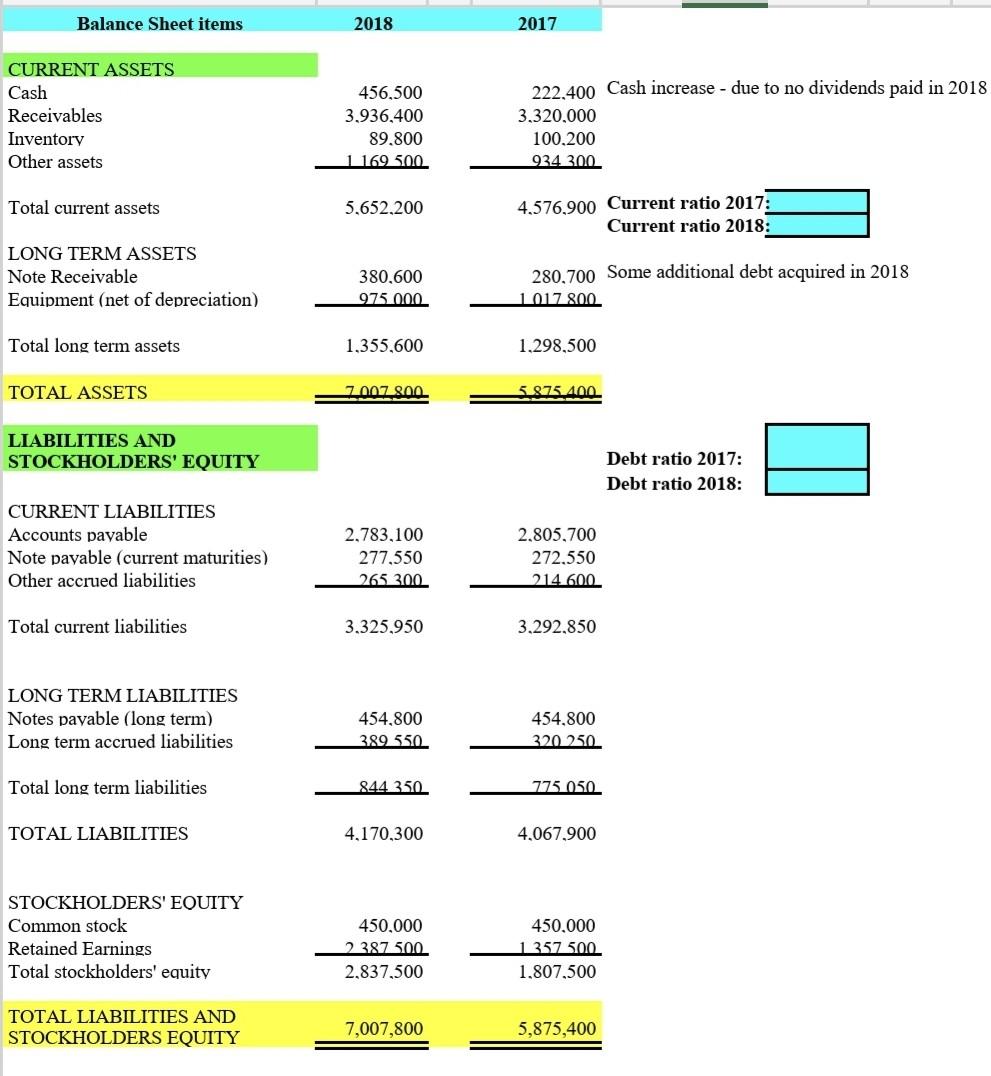
Balance Sheet items 2018 2017 CURRENT ASSETS Cash Receivables Inventory Other assets 456,500 3.936,400 89.800 1 169 500 222,400 Cash increase - due to no dividends paid in 2018 3.320.000 100.200 934.300 Total current assets 5.652,200 4.576,900 Current ratio 2017: Current ratio 2018: LONG TERM ASSETS Note Receivable Equipment (net of depreciation) 380,600 975.000 280,700 Some additional debt acquired in 2018 1017 800 Total long term assets 1,355,600 1.298,500 TOTAL ASSETS 2007.800 5.875.400 LIABILITIES AND STOCKHOLDERS' EQUITY Debt ratio 2017: Debt ratio 2018: CURRENT LIABILITIES Accounts payable Note payable (current maturities) Other accrued liabilities 2.783,100 277,550 265 300 2.805,700 272.550 214.600 Total current liabilities 3.325,950 3.292.850 LONG TERM LIABILITIES Notes payable (long term) Long term accrued liabilities 454,800 389 550 454.800 320.250 Total long term liabilities 844 350 775 050 TOTAL LIABILITIES 4,170,300 4.067.900 STOCKHOLDERS' EQUITY Common stock Retained Earnings Total stockholders' equity 450.000 2387500 2.837,500 450.000 1357 500 1.807,500 TOTAL LIABILITIES AND STOCKHOLDERS EQUITY 7,007,800 5,875,400 Balance Sheet items 2018 2017 CURRENT ASSETS Cash Receivables Inventory Other assets 456,500 3.936,400 89.800 1 169 500 222,400 Cash increase - due to no dividends paid in 2018 3.320.000 100.200 934.300 Total current assets 5.652,200 4.576,900 Current ratio 2017: Current ratio 2018: LONG TERM ASSETS Note Receivable Equipment (net of depreciation) 380,600 975.000 280,700 Some additional debt acquired in 2018 1017 800 Total long term assets 1,355,600 1.298,500 TOTAL ASSETS 2007.800 5.875.400 LIABILITIES AND STOCKHOLDERS' EQUITY Debt ratio 2017: Debt ratio 2018: CURRENT LIABILITIES Accounts payable Note payable (current maturities) Other accrued liabilities 2.783,100 277,550 265 300 2.805,700 272.550 214.600 Total current liabilities 3.325,950 3.292.850 LONG TERM LIABILITIES Notes payable (long term) Long term accrued liabilities 454,800 389 550 454.800 320.250 Total long term liabilities 844 350 775 050 TOTAL LIABILITIES 4,170,300 4.067.900 STOCKHOLDERS' EQUITY Common stock Retained Earnings Total stockholders' equity 450.000 2387500 2.837,500 450.000 1357 500 1.807,500 TOTAL LIABILITIES AND STOCKHOLDERS EQUITY 7,007,800 5,875,400
Step by Step Solution
There are 3 Steps involved in it

Get step-by-step solutions from verified subject matter experts